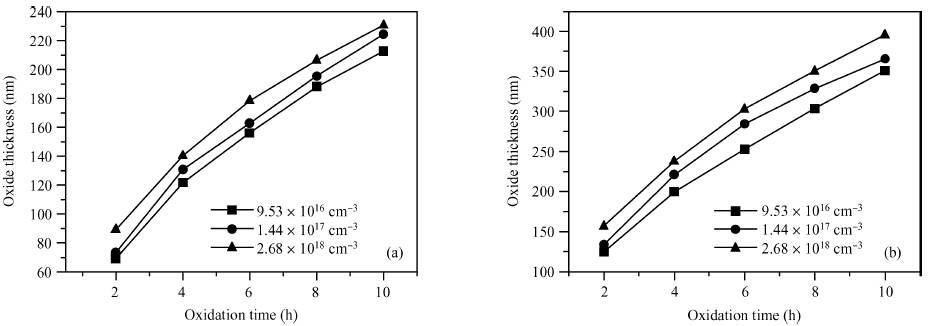
1. Introduction
Silicon carbon (SiC), a typical significant wide-gap semiconductor material, which is widely used in electronic devices that operate under high power, high frequency, and high temperature because of its advantageous properties[1]. One of the major advantages SiC possesses over other wide band gap semiconductors is that SiC is the only wide band gap semiconductor that can be thermally oxidized to form native SiO2 dielectric layers, similar to the silicon growth mechanism. The thermal growth of dielectric films on semiconductor substrates plays a central role in device technology, and it is important to have a good command of the thermal oxidation rates. As for the effect of doping on the thermal oxidation rate, some models have been built[2, 3] and some research has been done. For example, in 2011, Fu found that the doping concentration significantly affects the kinetics of thermal oxidation[4]. Dass from the University of South Carolina also researched the doping dependence of thermal oxidation on n-type 4H-SiC[5]. However, there has been no systematic~research on the oxidation of 6H-SiC.
In this paper, the doping dependence of thermal oxidation rates on n-type 6H-SiC was investigated. By combining a modified deal-grove model and Arrhenius equation, the linear and parabolic rate constants and their corresponding activation energies were extracted. Moreover, a discussion of the explanation and the extracted Arrhenius activation energy are presented.
2. SiO\boldsymbol{_2} growth kinetics on SiC and Arrhenius equation
2.1 The oxide process of SiC
The chemical reaction of SiC oxidation can be given by:
{\rm SiC}+{\rm 1.5O_2} \longleftrightarrow {\rm SiO_2}+{\rm CO}. |
(1) |
There are five major steps in the thermal oxidation of SiC:
(1) Transport of molecular oxygen gas to the oxide surface;
(2) In-diffusion of O_{2} through the oxide film;
(3) Reaction with SiC at the oxide/SiC interface;
(4) Out-diffusion of product gases (e.g., CO) through the oxide film;
(5) Removal of product gases away from the oxide surface[2].
The last two steps are not involved in the oxidation of Si. For the SiC oxidation, the out-diffusion of product gases step is the rate-controlling step[6].
2.2 Modified deal-grove model for SiC
The kinetics of thermal oxidation of SiC obeys the following equation:
X^2+AX=B(t+\tau), | (2) |
t+\tau=\frac{X^2}{B}+\frac{X}{B/A} |
(3) |
In this equation, we can deduce that, when the thickness of SiC oxide film is small, X is small, the dominate coefficient is B/A, which is called linear constant and is proportional to the oxidation reaction rate constant at the wafer surface. While the thickness is large, X is large, the dominate coefficient is B, which is called a parabolic constant.
2.3 Arrhenius equation
This relationship between the chemical reaction rate and the reaction temperature was originally found by a Swedish scientist, Svante Arrhenius, in 1889. In this theory, each reaction rate coefficient k has a temperature dependency that is given by the Arrhenius equation:
k=A{\rm e}^{ -\frac{E_{\rm a}}{RT} }, | (4) |
By taking the natural logarithm of both sides of the equation, we get,
\ln K=\ln A-\frac{E_{\rm a}}{RT}, | (5) |
\ln K=-\frac{E_{\rm a}}{R} \frac{1}{T}+\ln A. |
(6) |
According to this equation, a plot of {\ln K} versus 1/T gives a straight line with a slope of -E_{\rm a}/R, from which the value of activation energy can be determined.
3. Experiments
The samples used were 5 \times 5 mm^{2} and they were cut from double side polished (0001)/(000\overline{1}) oriented 6H-SiC wafers without an epilayer. The Si-face of the wafer were doped with nitrogen at concentrations of 9.53 \times 10^{16}, 1.44 \times 10^{17}, 2.68 \times 10^{18} cm^{-3} by ion implantation. Before the oxidation all of the samples were cleaned by the standard Radio Corporation of America (RCA) cleaning procedure. The samples were divided into three groups, and oxidation time ranging from 2 to 10 h at 1050 and 1150 C separately. Dry oxidation was performed at atmospheric pressure by keeping the oxygen flow rate at 1.5~SLPM.
4. Results and discussion
The Woollam M-2000F spectroscopic ellipsometry (SE) was used to measure the oxide thickness at angles of incidence in 70^\circ, 75^\circ, and 80^\circ. Since all of our samples were double polished, backside reflection occurs below about 3.5 eV, where the absorption in 6H-SiC drops to zero. Thus, the photon energy range over 3.5-5.0 eV (66 spectral points) was used in the evaluation. The two layer model[8] was chosen to analyze the measured data, which are shown in Figures 1(a) and 1(b).
From Figure 1 it can be seen the oxide increases linearly with the oxidation time in a small time interval and there is a growth rate reduction in the later phase.
4.1 Extract \boldsymbol{\tau}
To extract \tau, Equations (3) can be written as in the following equation for a parabola~fitting,
t=\frac{x^2}{B}+\frac{A}{B}-\tau. |
(7) |
Figures 2(a) and 2(b) show the parabolic relationship of oxidation time t and oxide thickness X at 1050 C and 1150~C, respectively.
4.2 Extract the rate constant
By giving Equation (7) a slight transform, the constant B/A and B can be extracted successfully:
\frac{t+\tau}{X}=X/B+A/B. |
(8) |
In the fit curves, the slope gives the reciprocal of parabolic-rate-constant B and the vertical intercept gives the reciprocal of B/A, easily deducing the linear-rate-constant B/A and parabolic-rate-constant B that are shown in Tables 1 and 2.
From the above table it can be seen that a higher temperature corresponds to an increased linear-rate-constant and parabolic-rate-constant, indicating that increasing temperature can enhance the oxidation rate.
As the doping concentration increases, the linear and parabolic rate constant increases, which is~consistent~with References [4, 5].
4.3 Extract the linear and parabolic activation energy
The activation energy and pre-exponential factor can be obtained with Equation (6).
In Figure 3, the slope equals to -E_{\rm a}/R, and the vertical intercept equals the natural logarithm of pre-exponential factor. Thus, the corresponding linear and parabolic activation energies and pre-exponential factor can be easily obtained, as shown in Tables 3 and 4.
Tables 3 and 4 show an increase in the linear and parabolic activation energies, and the pre-exponential factor of linear-rate-constant and parabolic-rate-constant with doping concentration.
There are several explanations of the increased oxidation rate with doping concentration. (1) Research about SiC shows that before the Si-C bond is broken there would be a silicon oxycarbide generated, which can form a stable Si_{1-x}C_{x}O_{2} interphase between SiC and SiO_{2}, this step limits the rate of SiC oxidation[10]. When nitrogen is doped into the SiC, the structure of silicon oxycarbide can be destroyed by N, thus boosting the SiO_{2} growth rate[10, 11, 12, 13]. (2) Doping-induced defects also accounts for the increased oxidation rate. Since the substitutional nitrogen incorporated preferentially in the host carbon sites of the SiC epilayer will cause the lattice mismatch and misorientation[14, 15], oxidation becomes more easy because of the more dangling bonds[5].
However, it is unreasonable to use the variation of the extracted Arrhenius activation energy to explain the increased rate constant. From the perspective of the three levels of chemical reactions, as for the~overall~reaction, the activation energy extracted from Arrhenius equation is just an apparent and empirical~value, which has no actual physical meaning[16]. While in Reference [5], the extracted Arrhenius activation energy is used for the explanation. From the view of the~principle~of~chemical reaction, the products are formed only when the colliding molecules possess a certain minimum energy, which is called the threshold energy. The activation energy of an elementary reaction can be thought of as the height of the potential barrier (sometimes called the energy barrier) separating two minima of potential energy (of the reactants and products of a reaction), representing the ease of the reaction. That is, if a reaction takes place more easily, then the activation energy should be smaller. But the extracted Arrhenius activation energy in our experiment and Reference [5] increased with the doping concentration, this can also indirectly~demonstrate the irrationality of using the variation of Arrhenius activation energy as an explanation.
5. Conclusions
The results of our experiment certified the phenomenon~that doping with nitrogen will accelerate the reaction rate, which is consistent~with~the result of References~[4, 5].
In summary, we can draw the conclusion that (1) the doping of nitrogen will speed up the reaction rate; (2) the reaction rate will increase with the doping concentration; and, (3) it is unreasonable to use a variation of the extracted Arrhenius activation energy to explain the increased rate constant.
Further research under different temperatures can be done to obtain the corresponding relationship between pre-exponential factor, activation energy, and doping concentration, thus predicting the thermal oxidation rates corresponding to a certain doping concentration under a certain condition. Furthermore, experiments can be set to compare the oxidation of 4H-SiC and 6H-SiC.