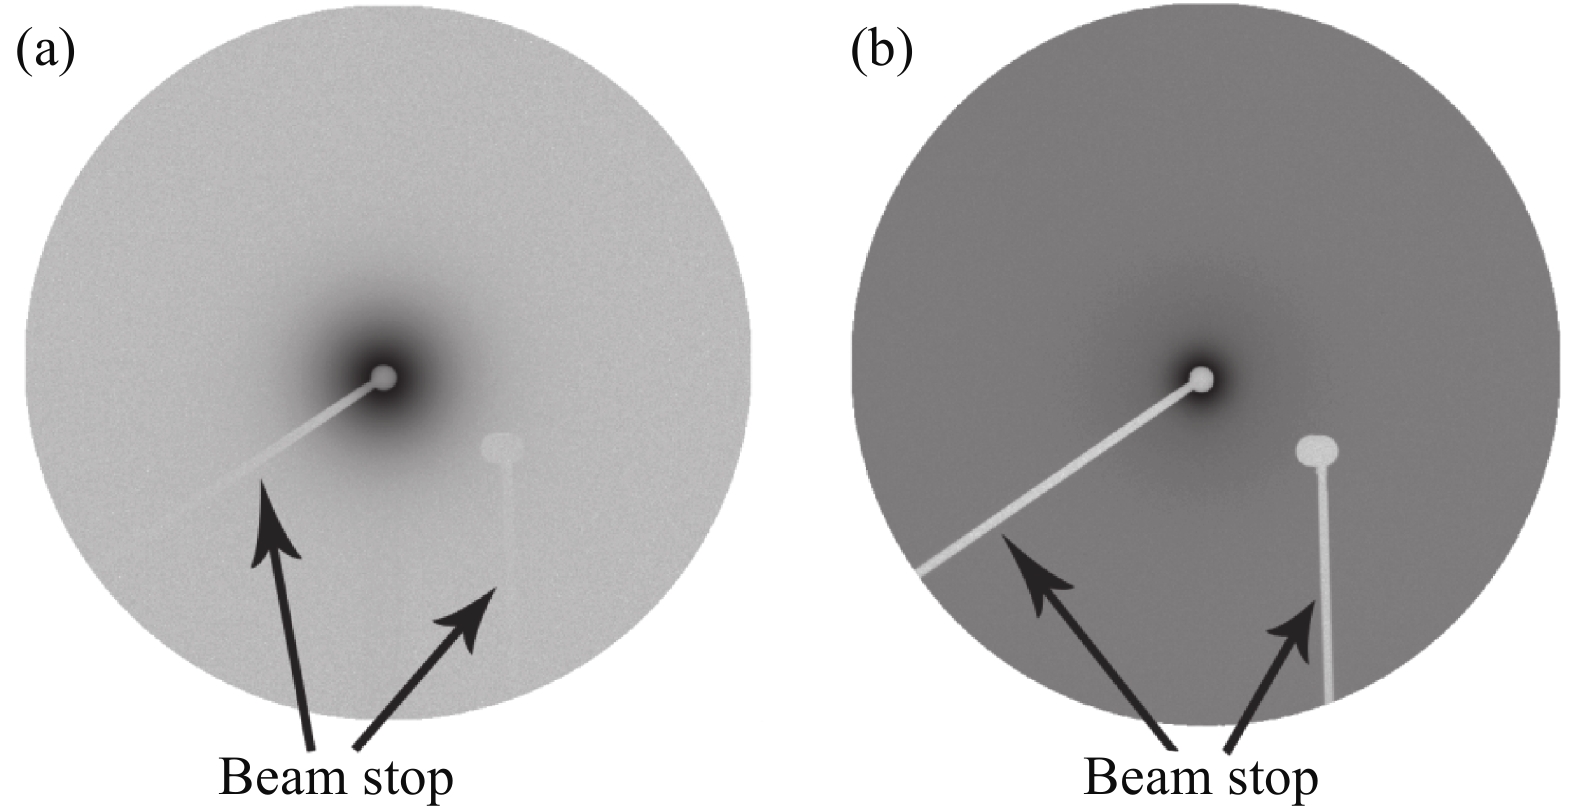
Fig. 1.
SAXS pattern of (a) SiC nanoparticles in tape and (b) the tape as background.
SEMICONDUCTOR MATERIALS
Baoxing Sun1, 2, Ruobing Xie1, , Cun Yu1, Cheng Li1 and Hongjie Xu1
Corresponding author: Ruobing Xie, Email: xieruobing@sinap.ac.cn
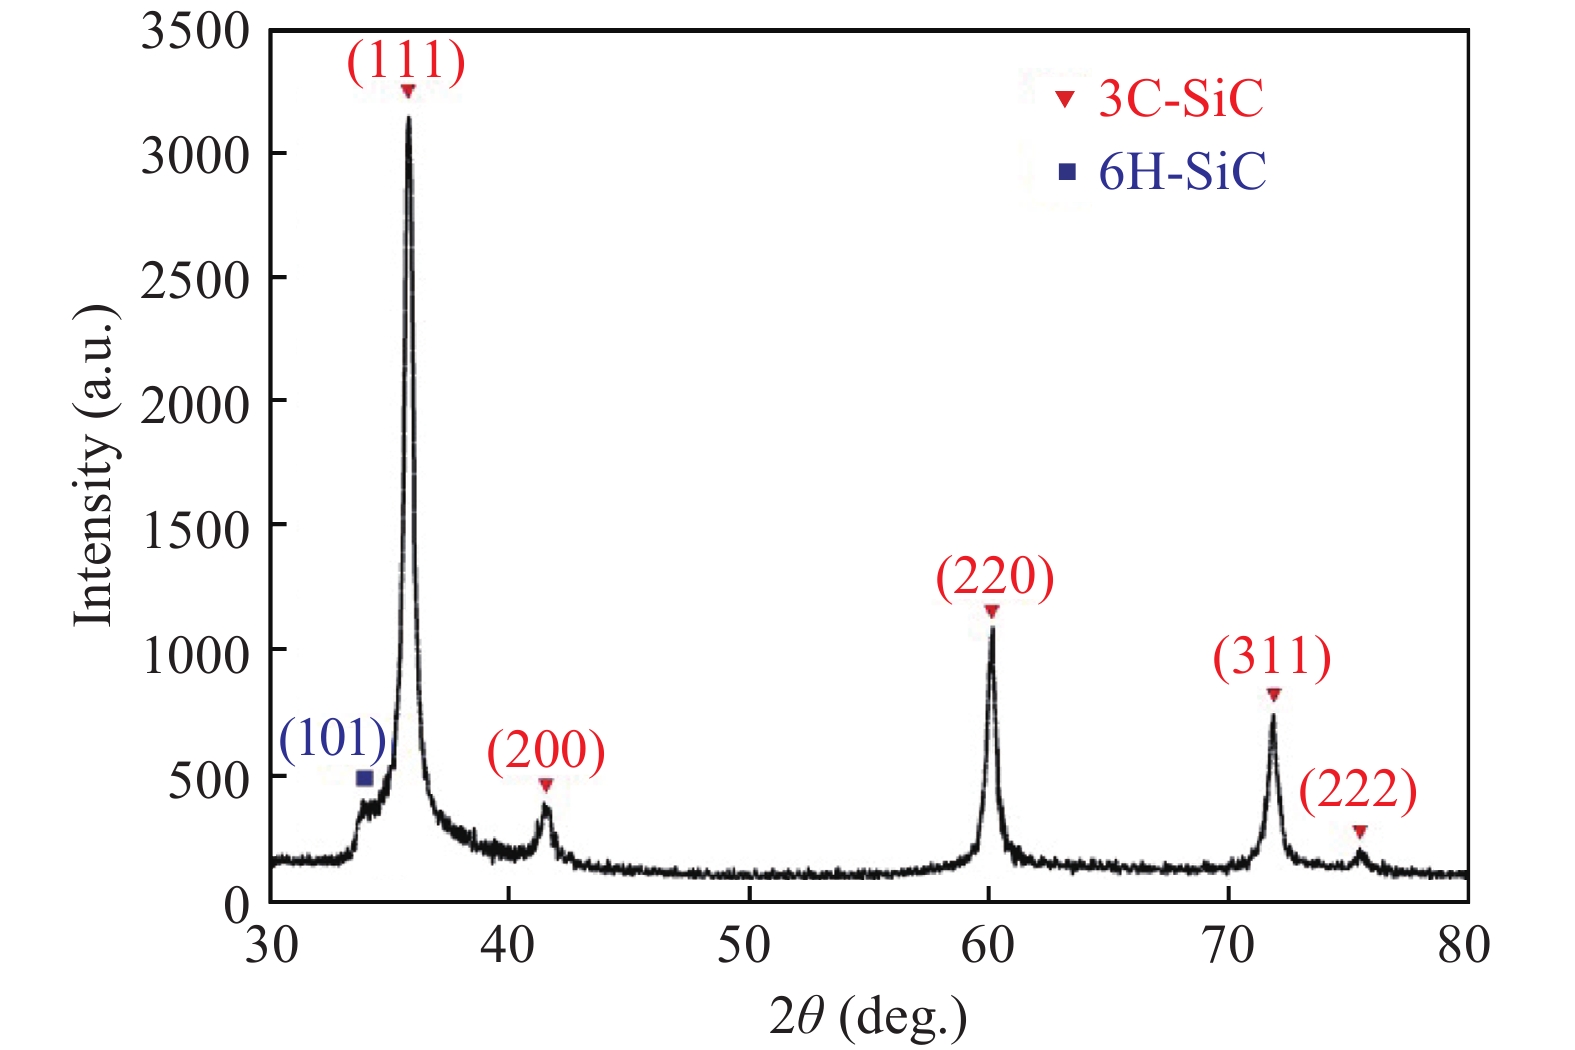
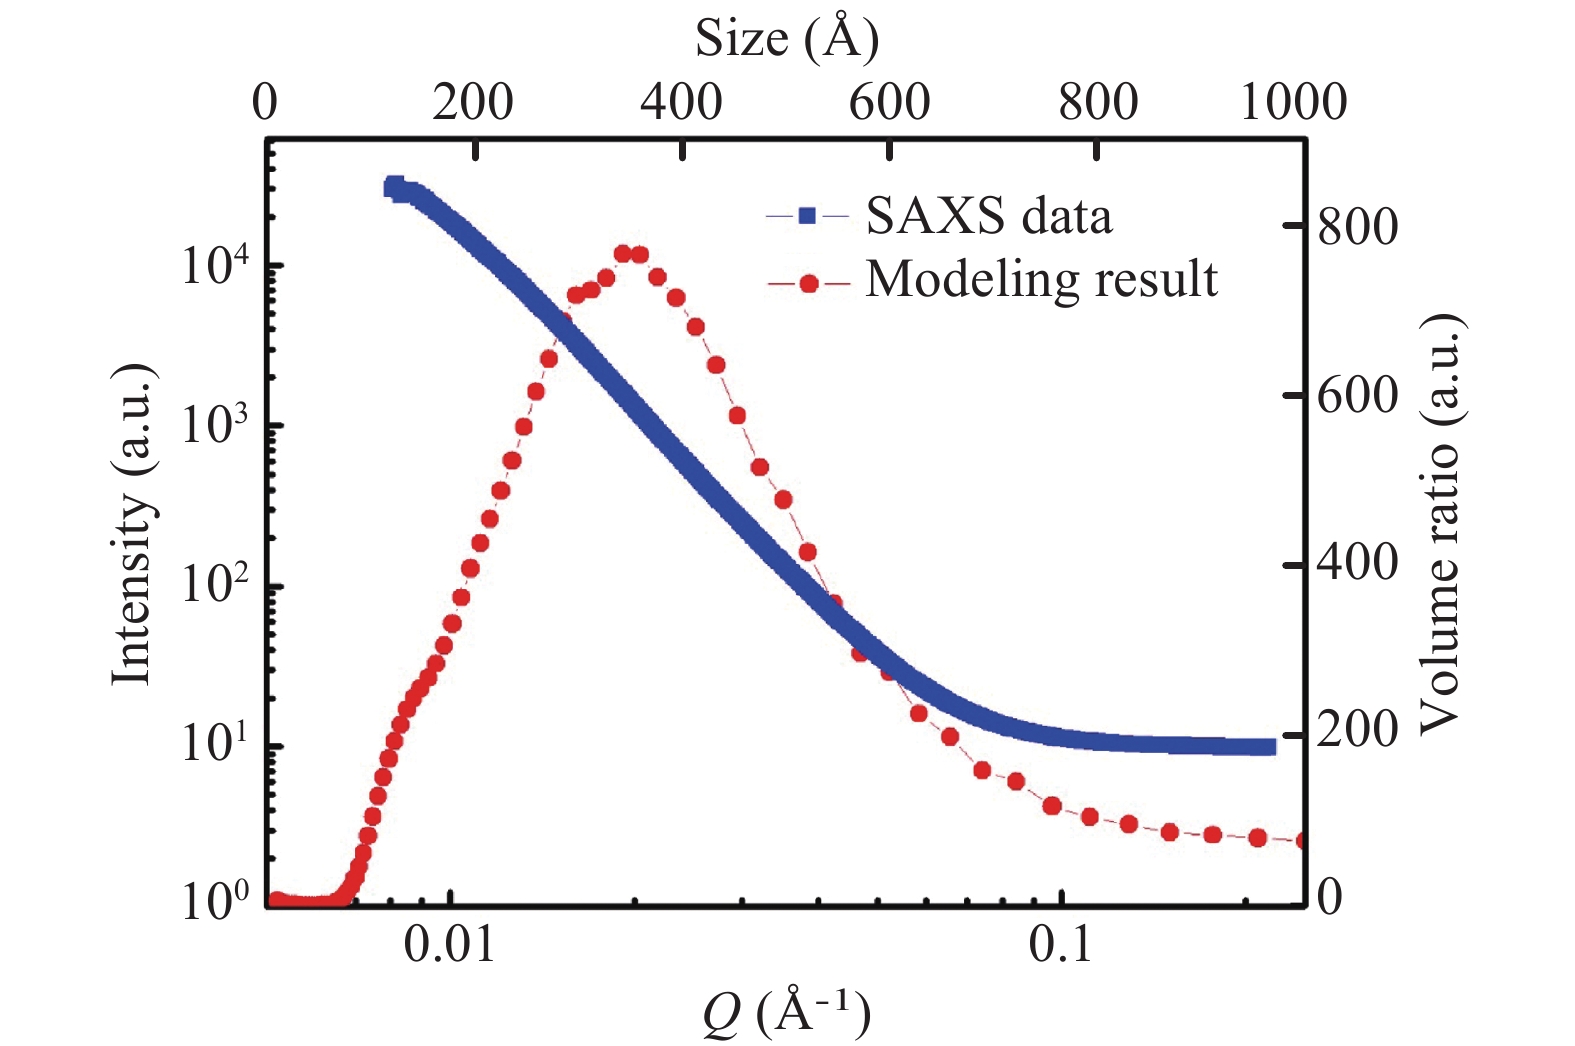
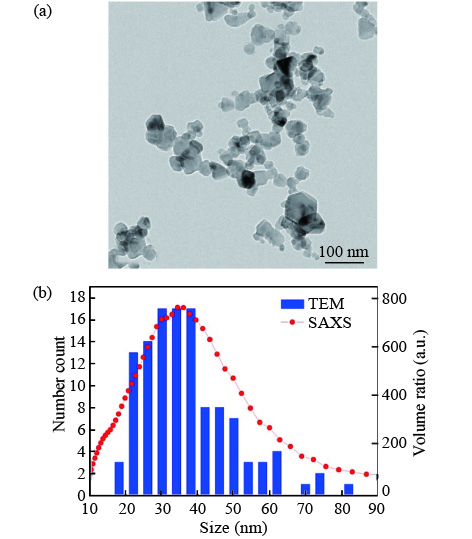
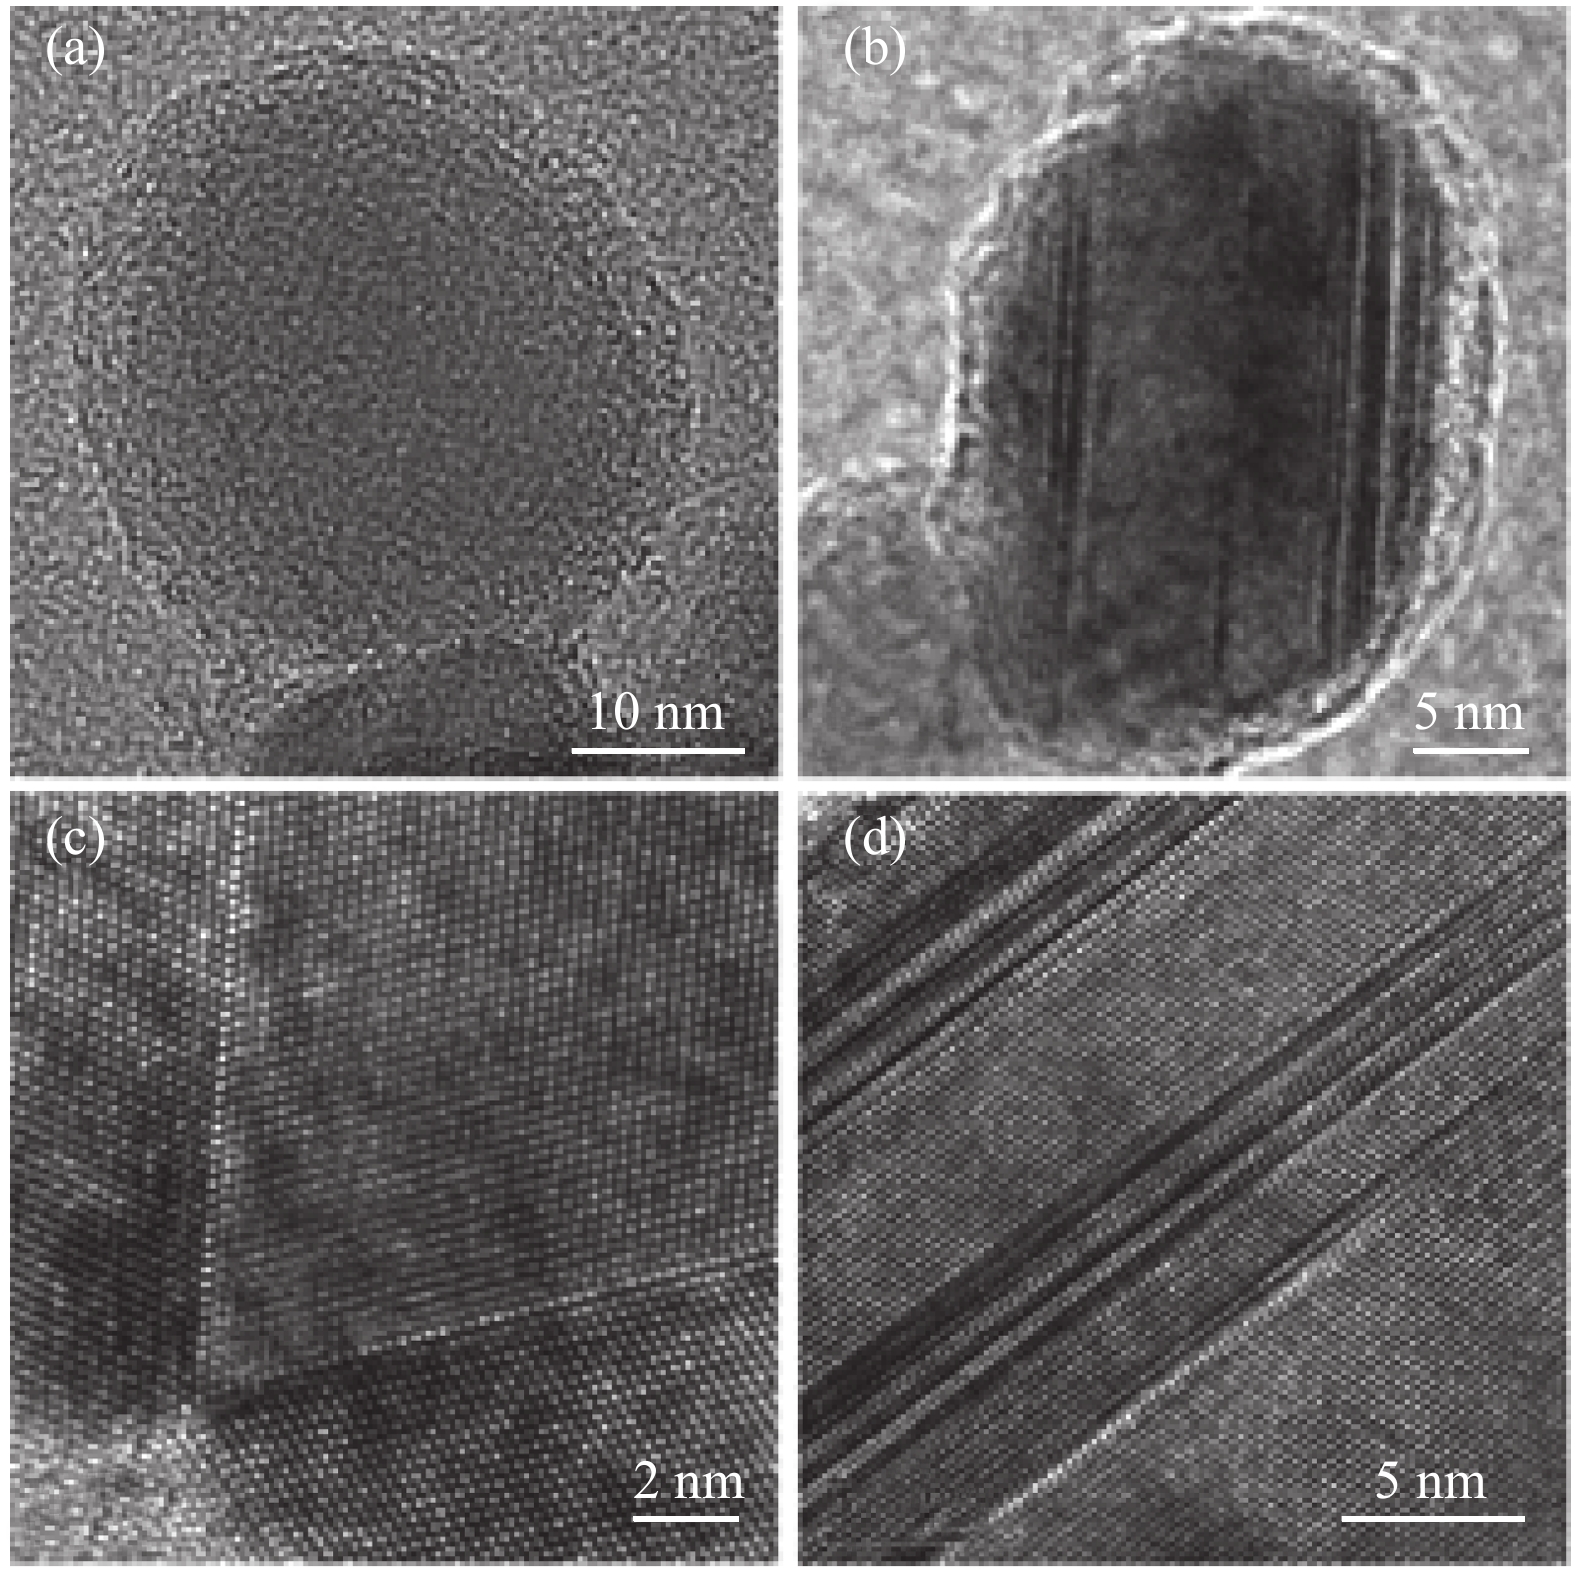
Abstract: The structure and size of SiC nanoparticles were studied by different characterization methods including small angle X-ray scattering (SAXS), transmission electron microscope (TEM), and X-ray diffraction (XRD). The results showed that particle size distributions determined respectively from SAXS and TEM are comparable and follow the log-normal function. The size distribution of the particles is between 10 to 100 nm with most of them being in the range of 20–50 nm. The average particle size is around 42 nm. XRD identifies the phase of the SiC nanoparticles and suggests the average size of the single crystalline domain to be around 21 nm. The combined results from XRD and SAXS suggest the existence of many polycrystals, which is confirmed by the HRTEM observation of particles with twins and stacking faults. The material synthesis methods leading to various particle sizes are also discussed.
Keywords: SiC nanoparticles, small angle X-ray scattering, XRD, TEM, SAXS
| [1] |
Nakamura K, Maeda K. Silicon carbide ceramics. Barking: Elsevier, 1999
|
| [2] |
Naslain R, Guette A, Rebillat F, et al. Boron-bearing species in ceramic matrix composites for long-term aerospace applications. J Solid State Chem, 2004, 177: 449 doi: 10.1016/j.jssc.2003.03.005
|
| [3] |
Ivekovi A, Novak S, Drazic G, et al. Current status and prospects of SiCf/SiC for fusion structural applications. J Eur Ceram Soc, 2013, 33: 1577 doi: 10.1016/j.jeurceramsoc.2013.02.013
|
| [4] |
Tang S, Deng J, Wang S, et al. Comparison of thermal and ablation behaviors of C/SiC composites and C/ZrB2-SiC composites. Corros Sci, 2009, 51: 54 doi: 10.1016/j.corsci.2008.09.037
|
| [5] |
Dapkunas S. J. Ceramic heat exchangers. Am Ceram Soc Bull, 1988, 67: 388
|
| [6] |
Krenkel W, Berndt F. C/C–SiC composites for space applications and advanced friction systems. Mater Sci Eng A, 2005, 412: 177 doi: 10.1016/j.msea.2005.08.204
|
| [7] |
Tomar V. Analyses of the role of the second phase SiC particles in microstructure dependent fracture. Modelling Simul Mater Sci Eng, 2008, 16: 035001 doi: 10.1088/0965-0393/16/3/035001
|
| [8] |
Tang S F, Deng J Y. Comparison of thermal and ablation behaviors of C/SiC composites and C/ZrB2-SiC composites. Corros Sci, 2009, 51: 54 doi: 10.1016/j.corsci.2008.09.037
|
| [9] |
Qiang X, Li H, Zhang Y, et al. Synthesis and Raman scattering of SiC nanowires decorated with SiC polycrystalline nanoparticles. Mater Lett, 2013, 107: 315 doi: 10.1016/j.matlet.2013.06.055
|
| [10] |
Jokubavicius V, Yazdi G, Ivanov I, et al. Surface engineering of SiC via sublimation etching. Appl Surf Sci, 2016, 390: 816 doi: 10.1016/j.apsusc.2016.08.149
|
| [11] |
Wong Eric W, Sheehan P E, Lieber C M. Nanobeam Mechanics: Elasticity, Strength, and Toughness of Nanorods and Nanotubes. Science, 1997, 277: 1971 doi: 10.1126/science.277.5334.1971
|
| [12] |
Raju K, Yoon D H. Sintering additives for SiC based on the reactivity: a review. Ceram Int, 2016, 42: 17947 doi: 10.1016/j.ceramint.2016.09.022
|
| [13] |
Nie K, Wang X, Xu F, et al. Microstructure and tensile properties of SiC nanoparticles reinforced magnesium matrix composite prepared by multidirectional forging under decreasing temperature conditions. Mater Sci Eng A, 2015, 639: 465 doi: 10.1016/j.msea.2015.05.030
|
| [14] |
Saberi Y, Zebarjad S M, Akbari G H. On the role of nano-size SiC on lattice strain and grain size of Al/SiC nanocomposite. J Alloys Compd, 2009, 484: 637 doi: 10.1016/j.jallcom.2009.05.009
|
| [15] |
Timofeeva E, Smith D, Yu W, et al. Particle size and interfacial effects on thermo-physical and heat transfer characteristics of water-based alpha-SiC nanofluids. Nanotechnology, 2010, 21: 215703 doi: 10.1088/0957-4484/21/21/215703
|
| [16] |
Shao M, Peles A, Shoemaker K. Electrocatalysis on platinum nanoparticles: particle size effect on oxygen reduction reaction activity. Nano Lett, 2011, 11: 3714 doi: 10.1021/nl2017459
|
| [17] |
Xie R, Ilavsky J, Huang H, et al. Dispersed SiC nanoparticles in Ni observed by ultra small angle X-ray scattering. J Appl Cryst, 2016, 49: 2155 doi: 10.1107/S1600576716015090
|
| [18] |
Ilavsky J. Nika-software for 2D data reduction. J Appl Cryst, 2012, 45: 324 doi: 10.1107/S0021889812004037
|
| [19] |
Ilavsky J, Jemian P. Irena: tool suite for modeling and analysis of small-angle scattering. J App Cryst, 2009, 42: 347 doi: 10.1107/S0021889809002222
|
| [20] |
Langford J, Wilson A. Seherrer after sixty years: a survey and some new results in the determination of crystallite size. J Appl Cryst, 1978, 11: 102 doi: 10.1107/S0021889878012844
|
| [21] |
Martin H P, Ecke R, Muller E. Synthesis of nanocrystalline silicon carbide powder by carbothermal reduction. J Eur Ceram Soc, 1998, 18: 1737 doi: 10.1016/S0955-2219(98)00094-6
|
| [22] |
Cockeram B. Fracture strength of plate and tubular forms of monolithic silicon carbide produced by chemical vapor deposition. J Am Ceram Soc, 2002, 85: 603
|
| [23] |
Ko S M, Koo S M, Cho W S, et al. Synthesis of SiC nano-powder from organic precursors using RF inductively coupled thermal plasma. Ceram Int, 2012, 38: 1959 doi: 10.1016/j.ceramint.2011.10.028
|
| [24] |
Najafi A, Fard F, Rezaie H R, et al. Synthesis and characterization of SiC nano powder with low residual carbon processed by sol–gel method. Powder Technol, 2012, 219: 202 doi: 10.1016/j.powtec.2011.12.045
|


Article views: 5405 Times PDF downloads: 136 Times Cited by: 0 Times
Received: 18 April 2017 Revised: 21 April 2017 Online: Accepted Manuscript: 13 November 2017Published: 01 October 2017
| Citation: |
Baoxing Sun, Ruobing Xie, Cun Yu, Cheng Li, Hongjie Xu. Structural characterization of SiC nanoparticles[J]. Journal of Semiconductors, 2017, 38(10): 103002. doi: 10.1088/1674-4926/38/10/103002
****
B X Sun, R B Xie, C Yu, C Li, H J Xu. Structural characterization of SiC nanoparticles[J]. J. Semicond., 2017, 38(10): 103002. doi: 10.1088/1674-4926/38/10/103002.

|
| [1] |
Nakamura K, Maeda K. Silicon carbide ceramics. Barking: Elsevier, 1999
|
| [2] |
Naslain R, Guette A, Rebillat F, et al. Boron-bearing species in ceramic matrix composites for long-term aerospace applications. J Solid State Chem, 2004, 177: 449 doi: 10.1016/j.jssc.2003.03.005
|
| [3] |
Ivekovi A, Novak S, Drazic G, et al. Current status and prospects of SiCf/SiC for fusion structural applications. J Eur Ceram Soc, 2013, 33: 1577 doi: 10.1016/j.jeurceramsoc.2013.02.013
|
| [4] |
Tang S, Deng J, Wang S, et al. Comparison of thermal and ablation behaviors of C/SiC composites and C/ZrB2-SiC composites. Corros Sci, 2009, 51: 54 doi: 10.1016/j.corsci.2008.09.037
|
| [5] |
Dapkunas S. J. Ceramic heat exchangers. Am Ceram Soc Bull, 1988, 67: 388
|
| [6] |
Krenkel W, Berndt F. C/C–SiC composites for space applications and advanced friction systems. Mater Sci Eng A, 2005, 412: 177 doi: 10.1016/j.msea.2005.08.204
|
| [7] |
Tomar V. Analyses of the role of the second phase SiC particles in microstructure dependent fracture. Modelling Simul Mater Sci Eng, 2008, 16: 035001 doi: 10.1088/0965-0393/16/3/035001
|
| [8] |
Tang S F, Deng J Y. Comparison of thermal and ablation behaviors of C/SiC composites and C/ZrB2-SiC composites. Corros Sci, 2009, 51: 54 doi: 10.1016/j.corsci.2008.09.037
|
| [9] |
Qiang X, Li H, Zhang Y, et al. Synthesis and Raman scattering of SiC nanowires decorated with SiC polycrystalline nanoparticles. Mater Lett, 2013, 107: 315 doi: 10.1016/j.matlet.2013.06.055
|
| [10] |
Jokubavicius V, Yazdi G, Ivanov I, et al. Surface engineering of SiC via sublimation etching. Appl Surf Sci, 2016, 390: 816 doi: 10.1016/j.apsusc.2016.08.149
|
| [11] |
Wong Eric W, Sheehan P E, Lieber C M. Nanobeam Mechanics: Elasticity, Strength, and Toughness of Nanorods and Nanotubes. Science, 1997, 277: 1971 doi: 10.1126/science.277.5334.1971
|
| [12] |
Raju K, Yoon D H. Sintering additives for SiC based on the reactivity: a review. Ceram Int, 2016, 42: 17947 doi: 10.1016/j.ceramint.2016.09.022
|
| [13] |
Nie K, Wang X, Xu F, et al. Microstructure and tensile properties of SiC nanoparticles reinforced magnesium matrix composite prepared by multidirectional forging under decreasing temperature conditions. Mater Sci Eng A, 2015, 639: 465 doi: 10.1016/j.msea.2015.05.030
|
| [14] |
Saberi Y, Zebarjad S M, Akbari G H. On the role of nano-size SiC on lattice strain and grain size of Al/SiC nanocomposite. J Alloys Compd, 2009, 484: 637 doi: 10.1016/j.jallcom.2009.05.009
|
| [15] |
Timofeeva E, Smith D, Yu W, et al. Particle size and interfacial effects on thermo-physical and heat transfer characteristics of water-based alpha-SiC nanofluids. Nanotechnology, 2010, 21: 215703 doi: 10.1088/0957-4484/21/21/215703
|
| [16] |
Shao M, Peles A, Shoemaker K. Electrocatalysis on platinum nanoparticles: particle size effect on oxygen reduction reaction activity. Nano Lett, 2011, 11: 3714 doi: 10.1021/nl2017459
|
| [17] |
Xie R, Ilavsky J, Huang H, et al. Dispersed SiC nanoparticles in Ni observed by ultra small angle X-ray scattering. J Appl Cryst, 2016, 49: 2155 doi: 10.1107/S1600576716015090
|
| [18] |
Ilavsky J. Nika-software for 2D data reduction. J Appl Cryst, 2012, 45: 324 doi: 10.1107/S0021889812004037
|
| [19] |
Ilavsky J, Jemian P. Irena: tool suite for modeling and analysis of small-angle scattering. J App Cryst, 2009, 42: 347 doi: 10.1107/S0021889809002222
|
| [20] |
Langford J, Wilson A. Seherrer after sixty years: a survey and some new results in the determination of crystallite size. J Appl Cryst, 1978, 11: 102 doi: 10.1107/S0021889878012844
|
| [21] |
Martin H P, Ecke R, Muller E. Synthesis of nanocrystalline silicon carbide powder by carbothermal reduction. J Eur Ceram Soc, 1998, 18: 1737 doi: 10.1016/S0955-2219(98)00094-6
|
| [22] |
Cockeram B. Fracture strength of plate and tubular forms of monolithic silicon carbide produced by chemical vapor deposition. J Am Ceram Soc, 2002, 85: 603
|
| [23] |
Ko S M, Koo S M, Cho W S, et al. Synthesis of SiC nano-powder from organic precursors using RF inductively coupled thermal plasma. Ceram Int, 2012, 38: 1959 doi: 10.1016/j.ceramint.2011.10.028
|
| [24] |
Najafi A, Fard F, Rezaie H R, et al. Synthesis and characterization of SiC nano powder with low residual carbon processed by sol–gel method. Powder Technol, 2012, 219: 202 doi: 10.1016/j.powtec.2011.12.045
|

 WeChat ID
Journal of Semiconductors © 2017 All Rights Reserved 京ICP备05085259号-2

 DownLoad: