J. Semicond. > 2022, Volume 43 > Issue 4 > 041103

REVIEWS

Study of structure-property relationship of semiconductor nanomaterials by off-axis electron holography

Luying Li1, , Yongfa Cheng1, Zunyu Liu1, Shuwen Yan1, Li Li1, Jianbo Wang2, Lei Zhang3 and Yihua Gao1

+ Author Affiliations

 Corresponding author: Luying Li, luying.li@hust.edu.cn

DOI: 10.1088/1674-4926/43/4/041103

PDF

Turn off MathJax

Abstract: As the scaling down of semiconductor devices, it would be necessary to discover the structure-property relationship of semiconductor nanomaterials at nanometer scale. In this review, the quantitative characterization technique off-axis electron holography is introduced in details, followed by its applications in various semiconductor nanomaterials including group IV, compound and two-dimensional semiconductor nanostructures in static states as well as under various stimuli. The advantages and disadvantages of off-axis electron holography in material analysis are discussed, the challenges facing in-situ electron holographic study of semiconductor devices at working conditions are presented, and all the possible influencing factors need to be considered to achieve the final goal of fulfilling quantitative characterization of the structure-property relationship of semiconductor devices at their working conditions.

Key words: semiconductor nanostructurestructure-property relationshipoff-axis electron holographyelectrostatic potentialcharge distribution


[1]
Waldrop M M. The chips are down for Moore's law. Nature, 2016, 530, 144 doi: 10.1038/530144a
[2]
Li L, Gan Z, McCartney M R, et al. Atomic configurations at InAs partial dislocation cores associated with Z-shape faulted dipoles. Sci Rep, 2013, 3, 3229 doi: 10.1038/srep03229
[3]
Li L, Tu F, Jin L, et al. Polarity continuation and frustration in ZnSe nanospirals. Sci Rep, 2014, 4, 7447 doi: 10.1038/srep07447
[4]
Smith D J. Atomic-resolution structure imaging of defects and interfaces in compound semiconductors. Prog Cryst Growth Charact Mater, 2020, 66, 100498 doi: 10.1016/j.pcrysgrow.2020.100498
[5]
Bragg W L. Microscopy by reconstructed wave-fronts. Nature, 1950, 166, 399 doi: 10.1038/166399b0
[6]
Crewe A V, Isaacson M, Johnson D. A simple scanning electron microscope. Rev Sci Instrum, 1969, 40, 241 doi: 10.1063/1.1683910
[7]
Cowley J M. Twenty forms of electron holography. Ultramicroscopy, 1992, 41, 335 doi: 10.1016/0304-3991(92)90213-4
[8]
Li L Y, Hu X K, Gao Y H. Electron holographic study of semiconductor light-emitting diodes. Small, 2018, 14, 1701996 doi: 10.1002/smll.201701996
[9]
Lichte H, Formanek P, Lenk A, et al. Electron holography: Applications to materials questions. Annu Rev Mater Res, 2007, 37, 539 doi: 10.1146/annurev.matsci.37.052506.084232
[10]
McCartney M R, Gajdardziska-Josifovska M. Absolute measurement of normalized thickness, t/λ i, from off-axis electron holography. Ultramicroscopy, 1994, 53, 283 doi: 10.1016/0304-3991(94)90040-X
[11]
Gribelyuk M A, McCartney M R, Li J, et al. Mapping of electrostatic potential in deep submicron CMOS devices by electron holography. Phys Rev Lett, 2002, 89, 025502 doi: 10.1103/PhysRevLett.89.025502
[12]
den Hertog M I, Schmid H, Cooper D, et al. Mapping active dopants in single silicon nanowires using off-axis electron holography. Nano Lett, 2009, 9, 3837 doi: 10.1021/nl902024h
[13]
Li L Y, Smith D J, Dailey E, et al. Observation of hole accumulation in Ge/Si core/shell nanowires using off-axis electron holography. Nano Lett, 2011, 11, 493 doi: 10.1021/nl1033107
[14]
Gan Z F, Gu M, Tang J S, et al. Direct mapping of charge distribution during lithiation of Ge nanowires using off-axis electron holography. Nano Lett, 2016, 16, 3748 doi: 10.1021/acs.nanolett.6b01099
[15]
Zhou L, Smith D J, McCartney M R, et al. Measurement of electric field across individual wurtzite GaN quantum dots using electron holography. Appl Phys Lett, 2011, 99, 101905 doi: 10.1063/1.3636109
[16]
McCartney M R, Dunin-Borkowski R E, Smith D J. Quantitative measurement of nanoscale electrostatic potentials and charges using off-axis electron holography: Developments and opportunities. Ultramicroscopy, 2019, 203, 105 doi: 10.1016/j.ultramic.2019.01.008
[17]
Kern F, Linck M, Wolf D, et al. Autocorrected off-axis holography of two-dimensional materials. Phys Rev Res, 2020, 2, 043360 doi: 10.1103/PhysRevResearch.2.043360
[18]
Li L Y, Ketharanathan S, Drucker J, et al. Study of hole accumulation in individual germanium quantum dots in p-type silicon by off-axis electron holography. Appl Phys Lett, 2009, 94, 232108 doi: 10.1063/1.3154524
[19]
Gan Z F, Perea D E, Yoo J, et al. Characterization of electrical properties in axial Si-Ge nanowire heterojunctions using off-axis electron holography and atom-probe tomography. J Appl Phys, 2016, 120, 104301 doi: 10.1063/1.4962380
[20]
Cheng F, Li B, Li L Y, et al. Study of the polarization effect in InAs quantum dots/GaAs nanowires. J Phys Chem C, 2019, 123, 4228 doi: 10.1021/acs.jpcc.8b11425
[21]
Li C, Cheng Y F, Li B, et al. Study of charge distributions and electrical properties in GaAs/AlGaAs single quantum well/nanowire heterostructures. J Phys Chem C, 2019, 123, 26888 doi: 10.1021/acs.jpcc.9b06371
[22]
Qi T Y, Cheng Y F, Cheng F, et al. Study of nanometer-scale structures and electrostatic properties of InAs quantum dots decorating GaAs/AlAs core/shell nanowires. Nanotechnology, 2020, 31, 245701 doi: 10.1088/1361-6528/ab767e
[23]
den Hertog M, Songmuang R, Monroy E. Polarization fields in GaN/AlN nanowire heterostructures studied by off-axis holography. J Phys: Conf Ser, 2013, 471, 012019 doi: 10.1088/1742-6596/471/1/012019
[24]
Chen X, Wang Y G, Guo J, et al. In-situ potential mapping of space charge layer in GaN nanowires under electrical field by off-axis electron holography. Prog Nat Sci Mater Int, 2016, 26, 163 doi: 10.1016/j.pnsc.2016.03.009
[25]
Chen X, Wang Y G, Jian J K, et al. Effect of strain on space charge layer in GaN nanowires investigated by in situ off-axis electron holography. Prog Nat Sci Mater Int, 2017, 27, 186 doi: 10.1016/j.pnsc.2017.02.003
[26]
Chen X, Wang Y G, Jian J K, et al. Controlling charges distribution at the surface of a single GaN nanowire by in situ strain. Prog Nat Sci Mater Int, 2017, 27, 430 doi: 10.1016/j.pnsc.2017.06.007
[27]
den Hertog M, Donatini F, McLeod R, et al. In situ biasing and off-axis electron holography of a ZnO nanowire. Nanotechnology, 2018, 29, 025710 doi: 10.1088/1361-6528/aa923c
[28]
Jiang F, Chen J W, Bi H, et al. The underlying micro-mechanism of performance enhancement of non-polar n-ZnO/p-AlGaN ultraviolet light emitting diode with i-ZnO inserted layer. Appl Phys Lett, 2018, 112, 033505 doi: 10.1063/1.5010594
[29]
Li X, Wen C Y, Yang L T, et al. Enhanced visualizing charge distribution of 2D/2D MXene/MoS2 heterostructure for excellent microwave absorption performance. J Alloys Compd, 2021, 869, 159365 doi: 10.1016/j.jallcom.2021.159365
[30]
Xing L S, Li X, Wu Z C, et al. 3D hierarchical local heterojunction of MoS2/FeS2 for enhanced microwave absorption. Chem Eng J, 2020, 379, 122241 doi: 10.1016/j.cej.2019.122241
[31]
Kawasaki T, Takahashi Y, Tanigaki T. Holography: application to high-resolution imaging. Microscopy, 2020, 70, 39 doi: 10.1093/jmicro/dfaa050
[32]
Wolf D, Lubk A, Prete P, et al. 3D mapping of nanoscale electric potentials in semiconductor structures using electron-holographic tomography. J Phys D, 2016, 49, 364004 doi: 10.1088/0022-3727/49/36/364004
[33]
Liu L Z Y, McAleese C, Sridhara Rao D V, et al. Electron holography of an in situ biased GaN-based LED. Phys Status Solidi C, 2012, 9, 704 doi: 10.1002/pssc.201100486
[34]
Yazdi S, Kasama T, Beleggia M, et al. Towards quantitative electrostatic potential mapping of working semiconductor devices using off-axis electron holography. Ultramicroscopy, 2015, 152, 10 doi: 10.1016/j.ultramic.2014.12.012
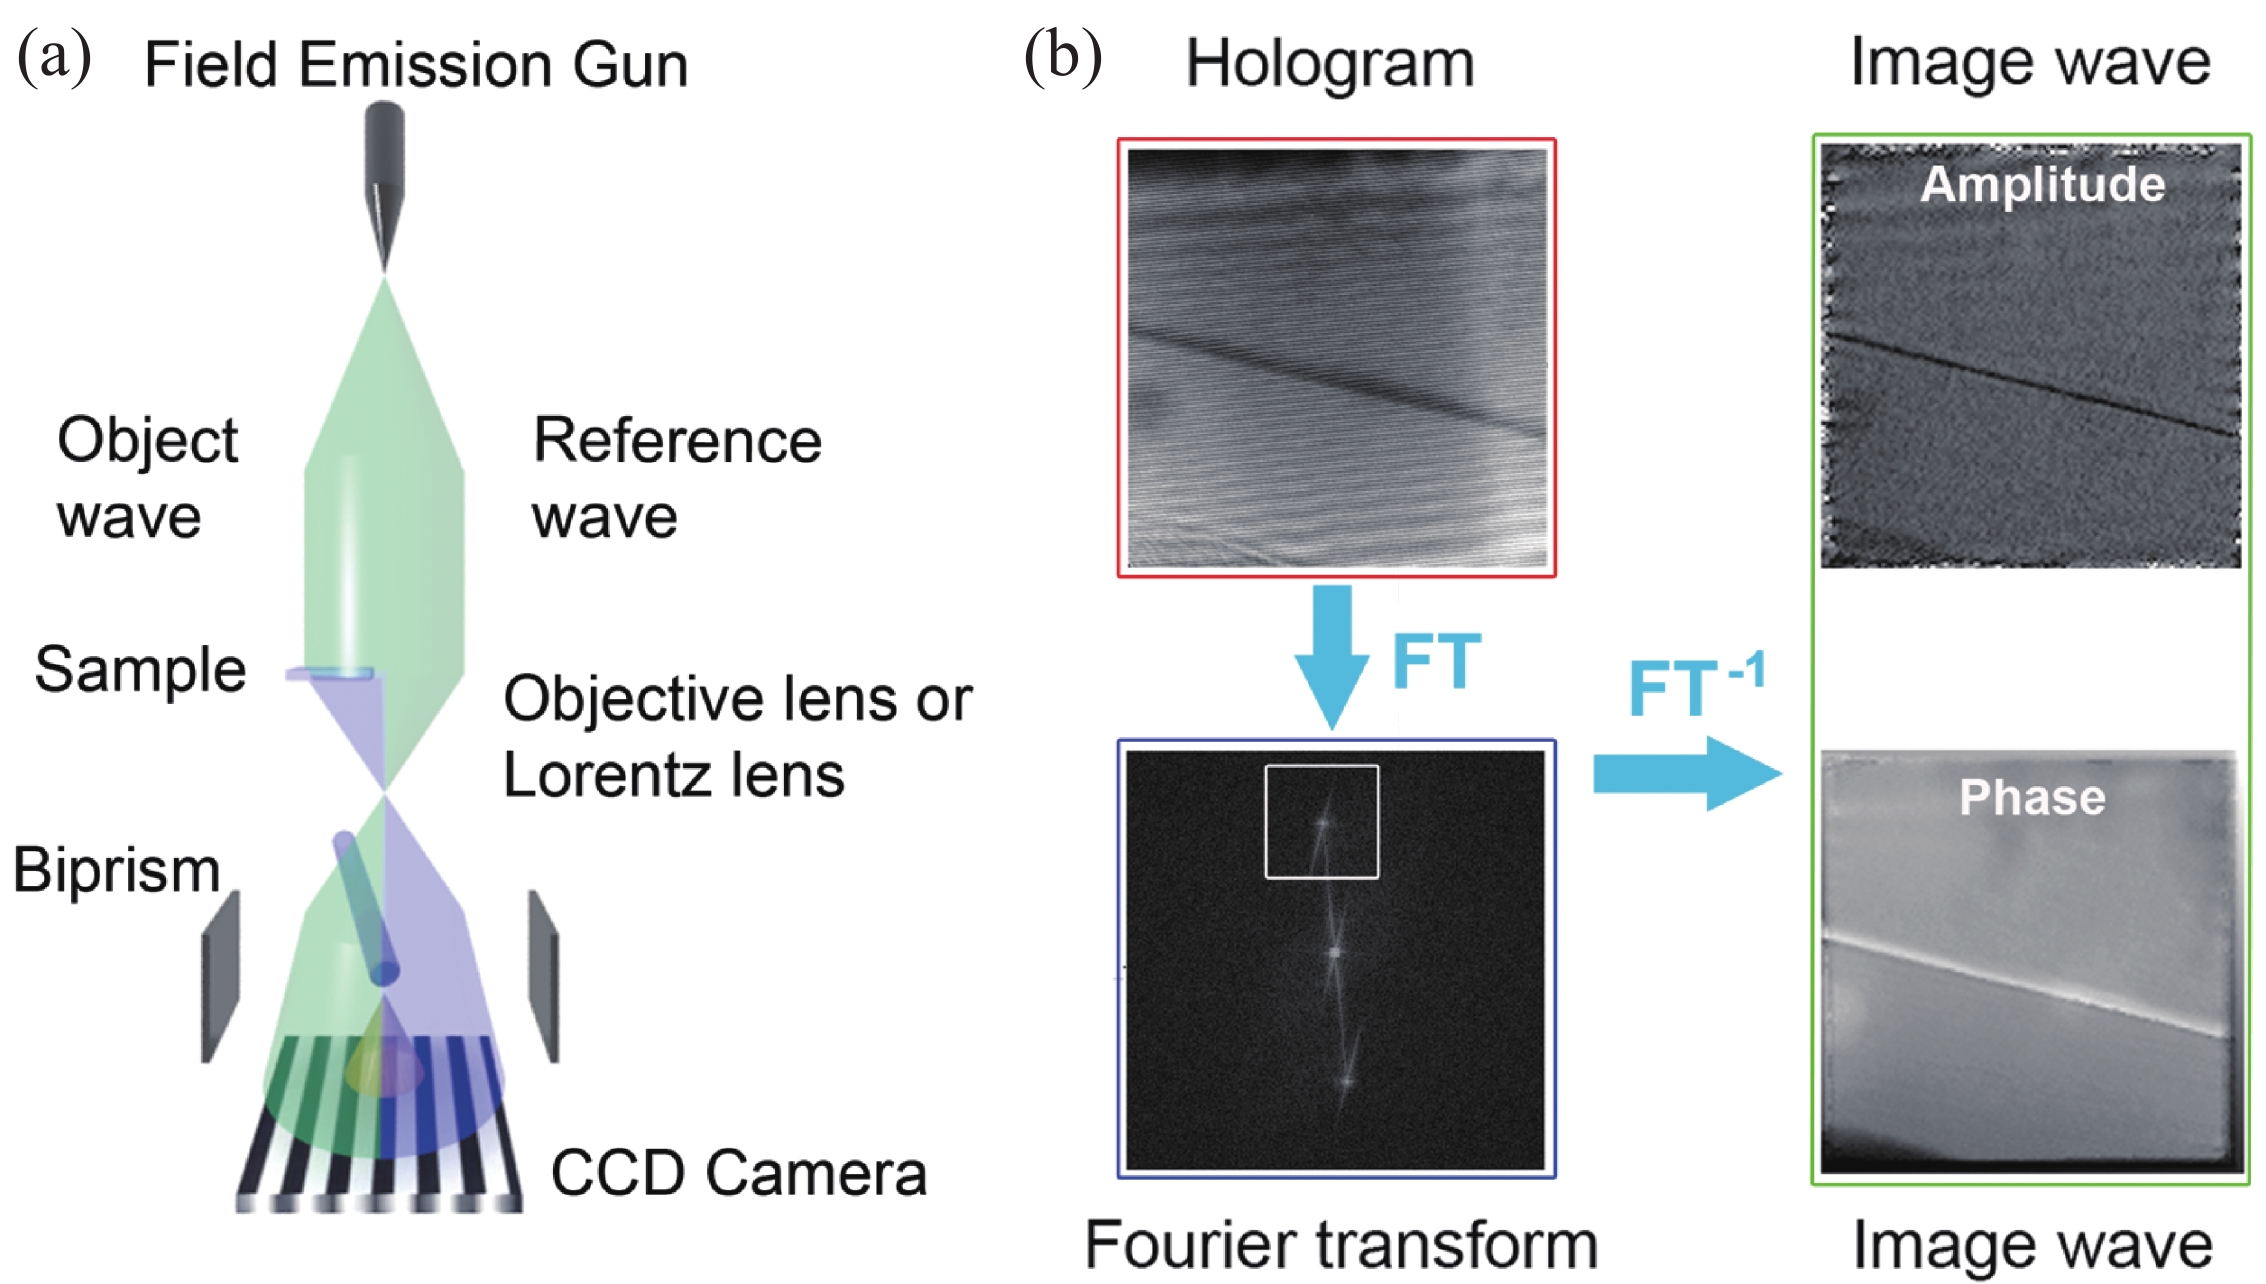
Fig. 1.  (Color online) (a) Sketch of off-axis electron holography including three important components: field emission gun, biprism and CCD camera. (b) The reconstruction process of a hologram: The Fourier transform of a hologram produces one center band and two conjugate side bands, one of which is selected and cut out. By applying an inverse Fourier transform, the corresponding amplitude image and phase image can be obtained[8].

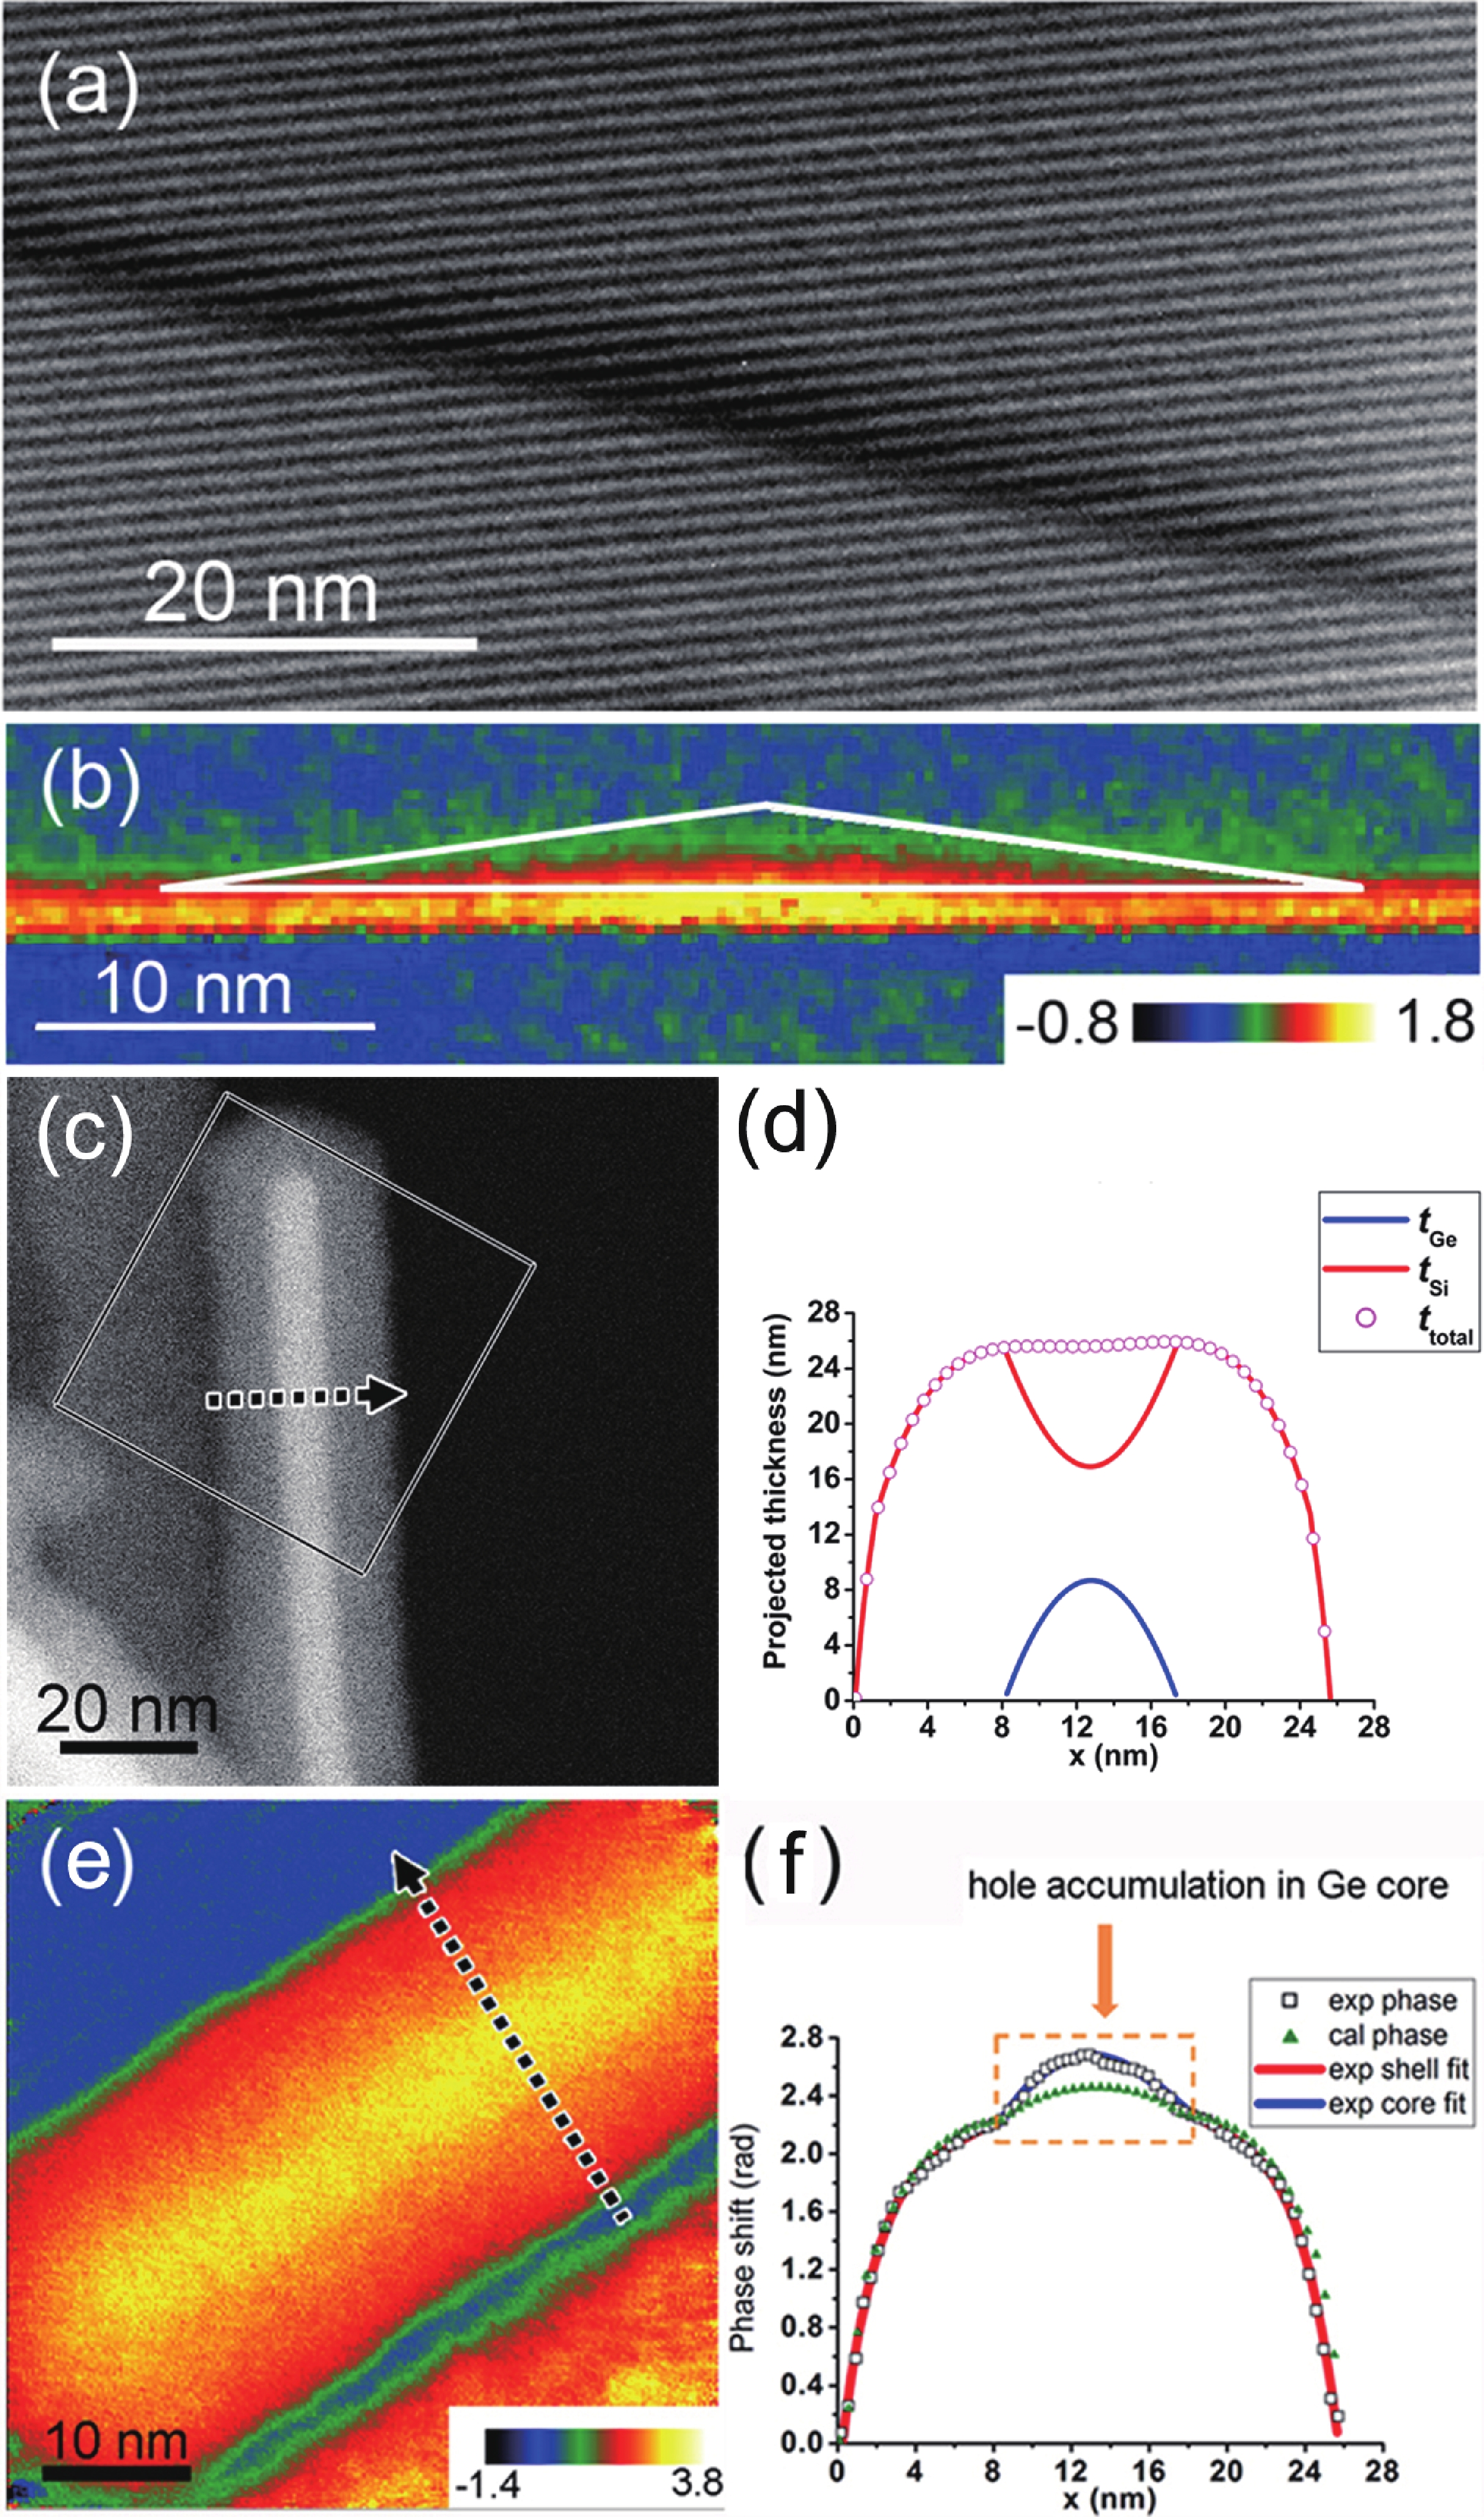
Fig. 2.  (Color online) (a, b) Electron hologram and phase image of specific Ge quantum dot sandwiched in Si substrates. The bottom of Ge dot shows extra positive phase shifts indicating holes accumulated in this region[18]. (c, d) HAADF image of a Ge/Si core/shell nanowire and the corresponding thicknesses of Ge core (blue) and Si shell (red) for the region indicated by a black-dotted arrow in (c). (e, f) Phase image of the same Ge/Si core/shell nanowire and corresponding phase shift line profile across the heterostructures labeled by a black dotted arrow in (e). Extra positive phase shifts appear in the Ge core region indicating hole accumulation in the Ge core[13].

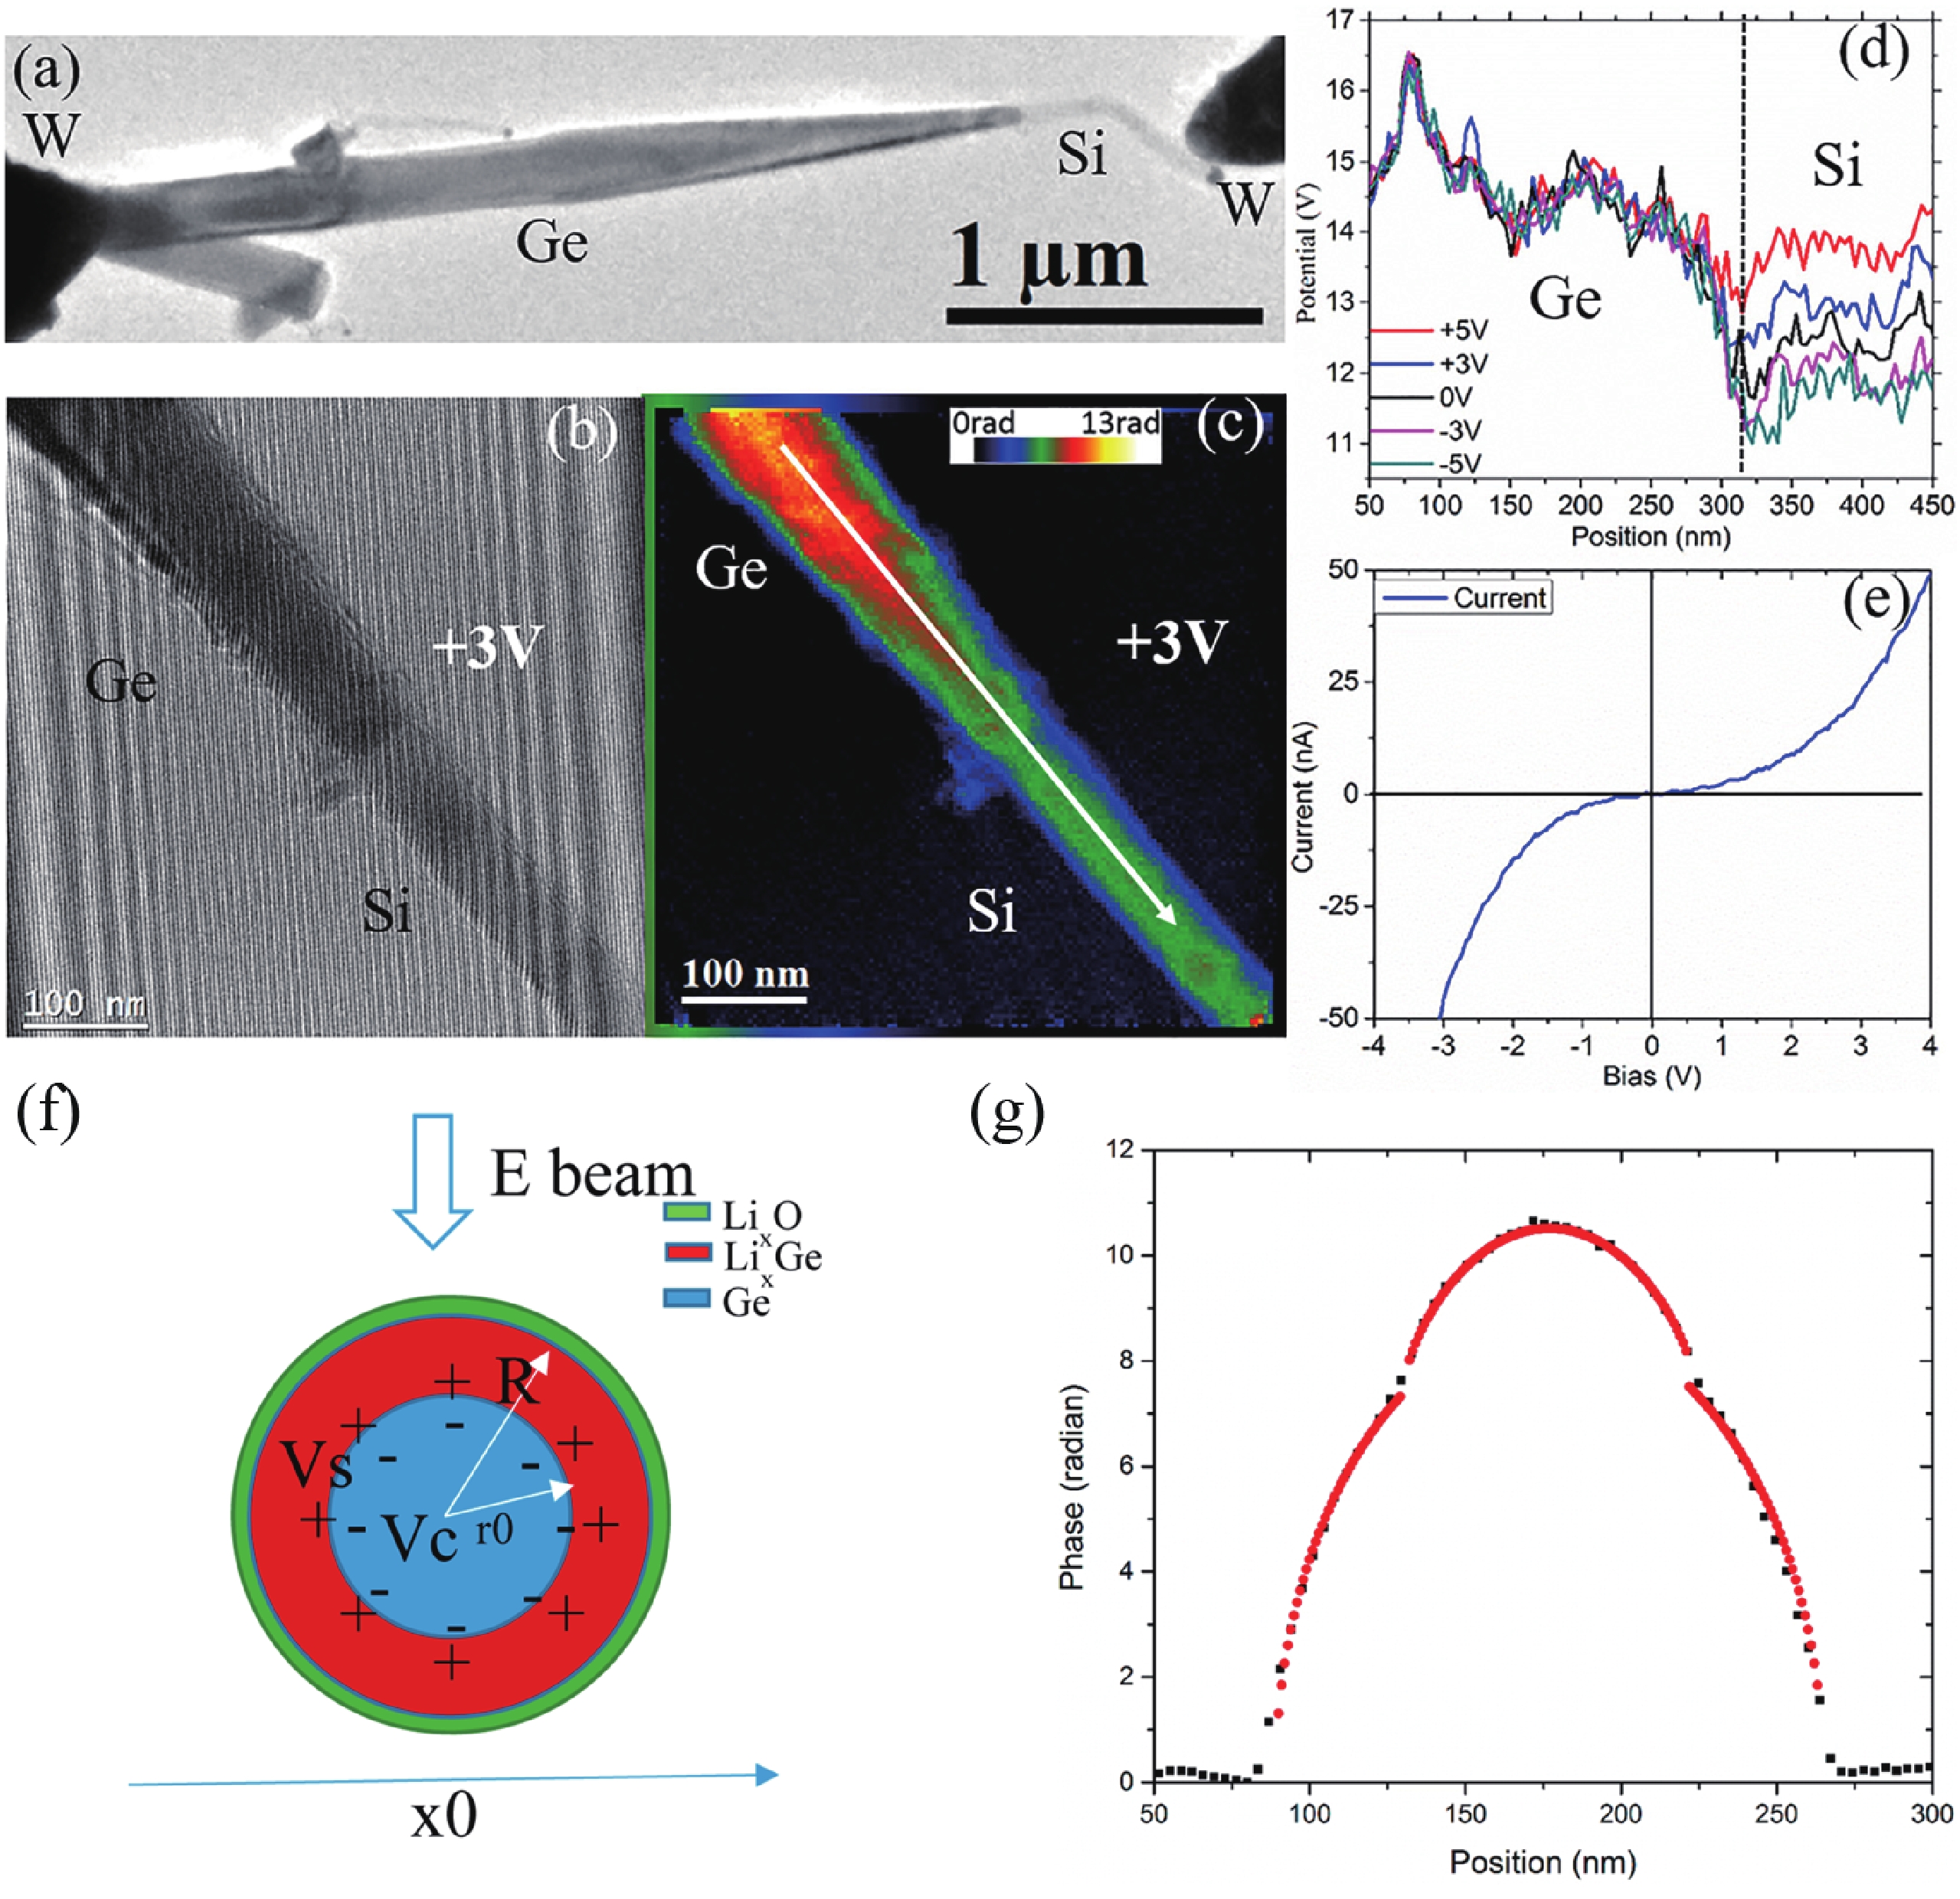
Fig. 3.  (Color online) (a, b) TEM image of an axially biased Si–Ge nanowire heterojunction, and the Ge side is grounded. (b) Electron hologram of the nanowire with +3 V bias on the Si side. (c) Corresponding phase image. (d) Potential line profile of the region indicated by a white arrow in (c), which show abrupt changes at positive bias, and comparatively much less variations at negative bias. (e) Corresponding I–V curve of the same nanowire[19]. (f) The sketch of the charge distribution model of the Ge/LixGe core/shell structure. (g) Experimental phase shift data (black dots) and the best fitting results based on the above charge distribution model (red dots)[14].

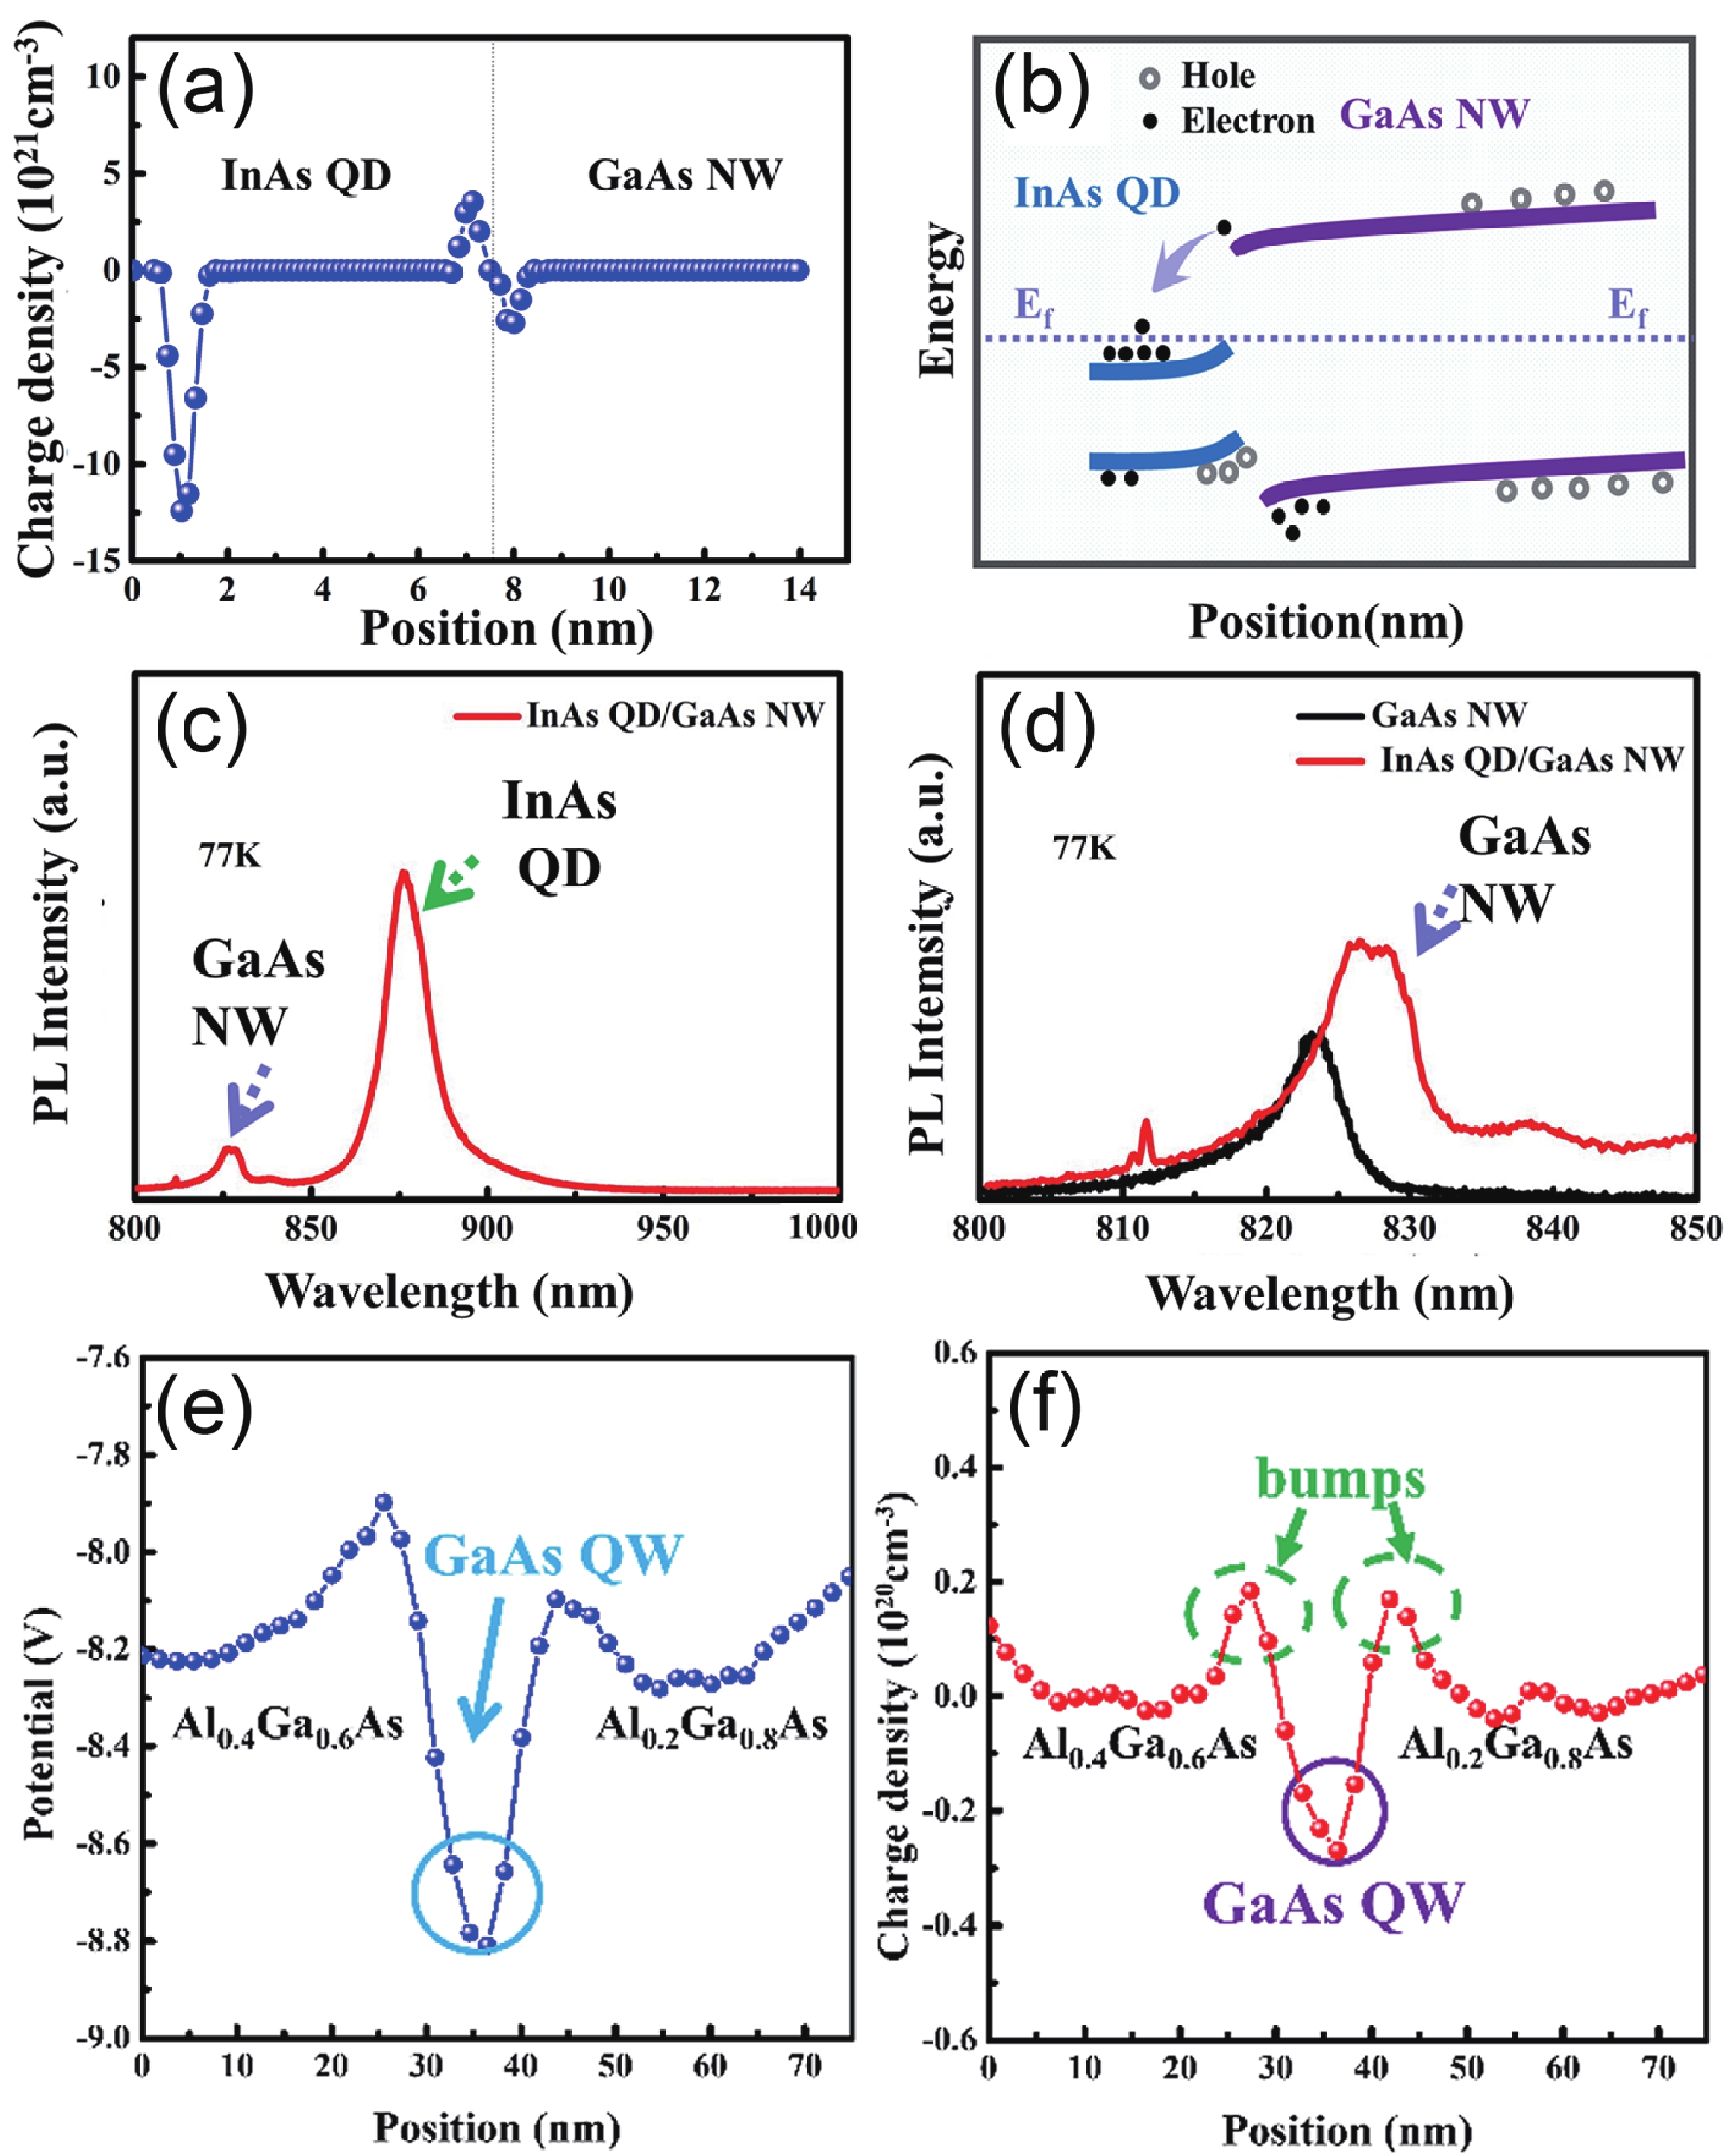
Fig. 4.  (Color online) (a) Charge distribution profile across InAs QD decorating GaAs NW hetero-interfaces obtained from holographic reconstruction of the phase shifts across the InAs QD/GaAs NW interface. (b) Band structure induced charge redistribution of InAs QDs/GaAs NW heterostructures, which confirms accumulation of electrons at the dot apex and charges of opposite signs distributed at the hetero-interface. (c, d) PL spectra of InAs QDs/GaAs NW (red) and pure GaAs NW (black) for comparison[20]. Line profiles of (e) electrostatic potential and (f) charge density across the GaAs/AlGaAs QW/NW heterostructures[21].

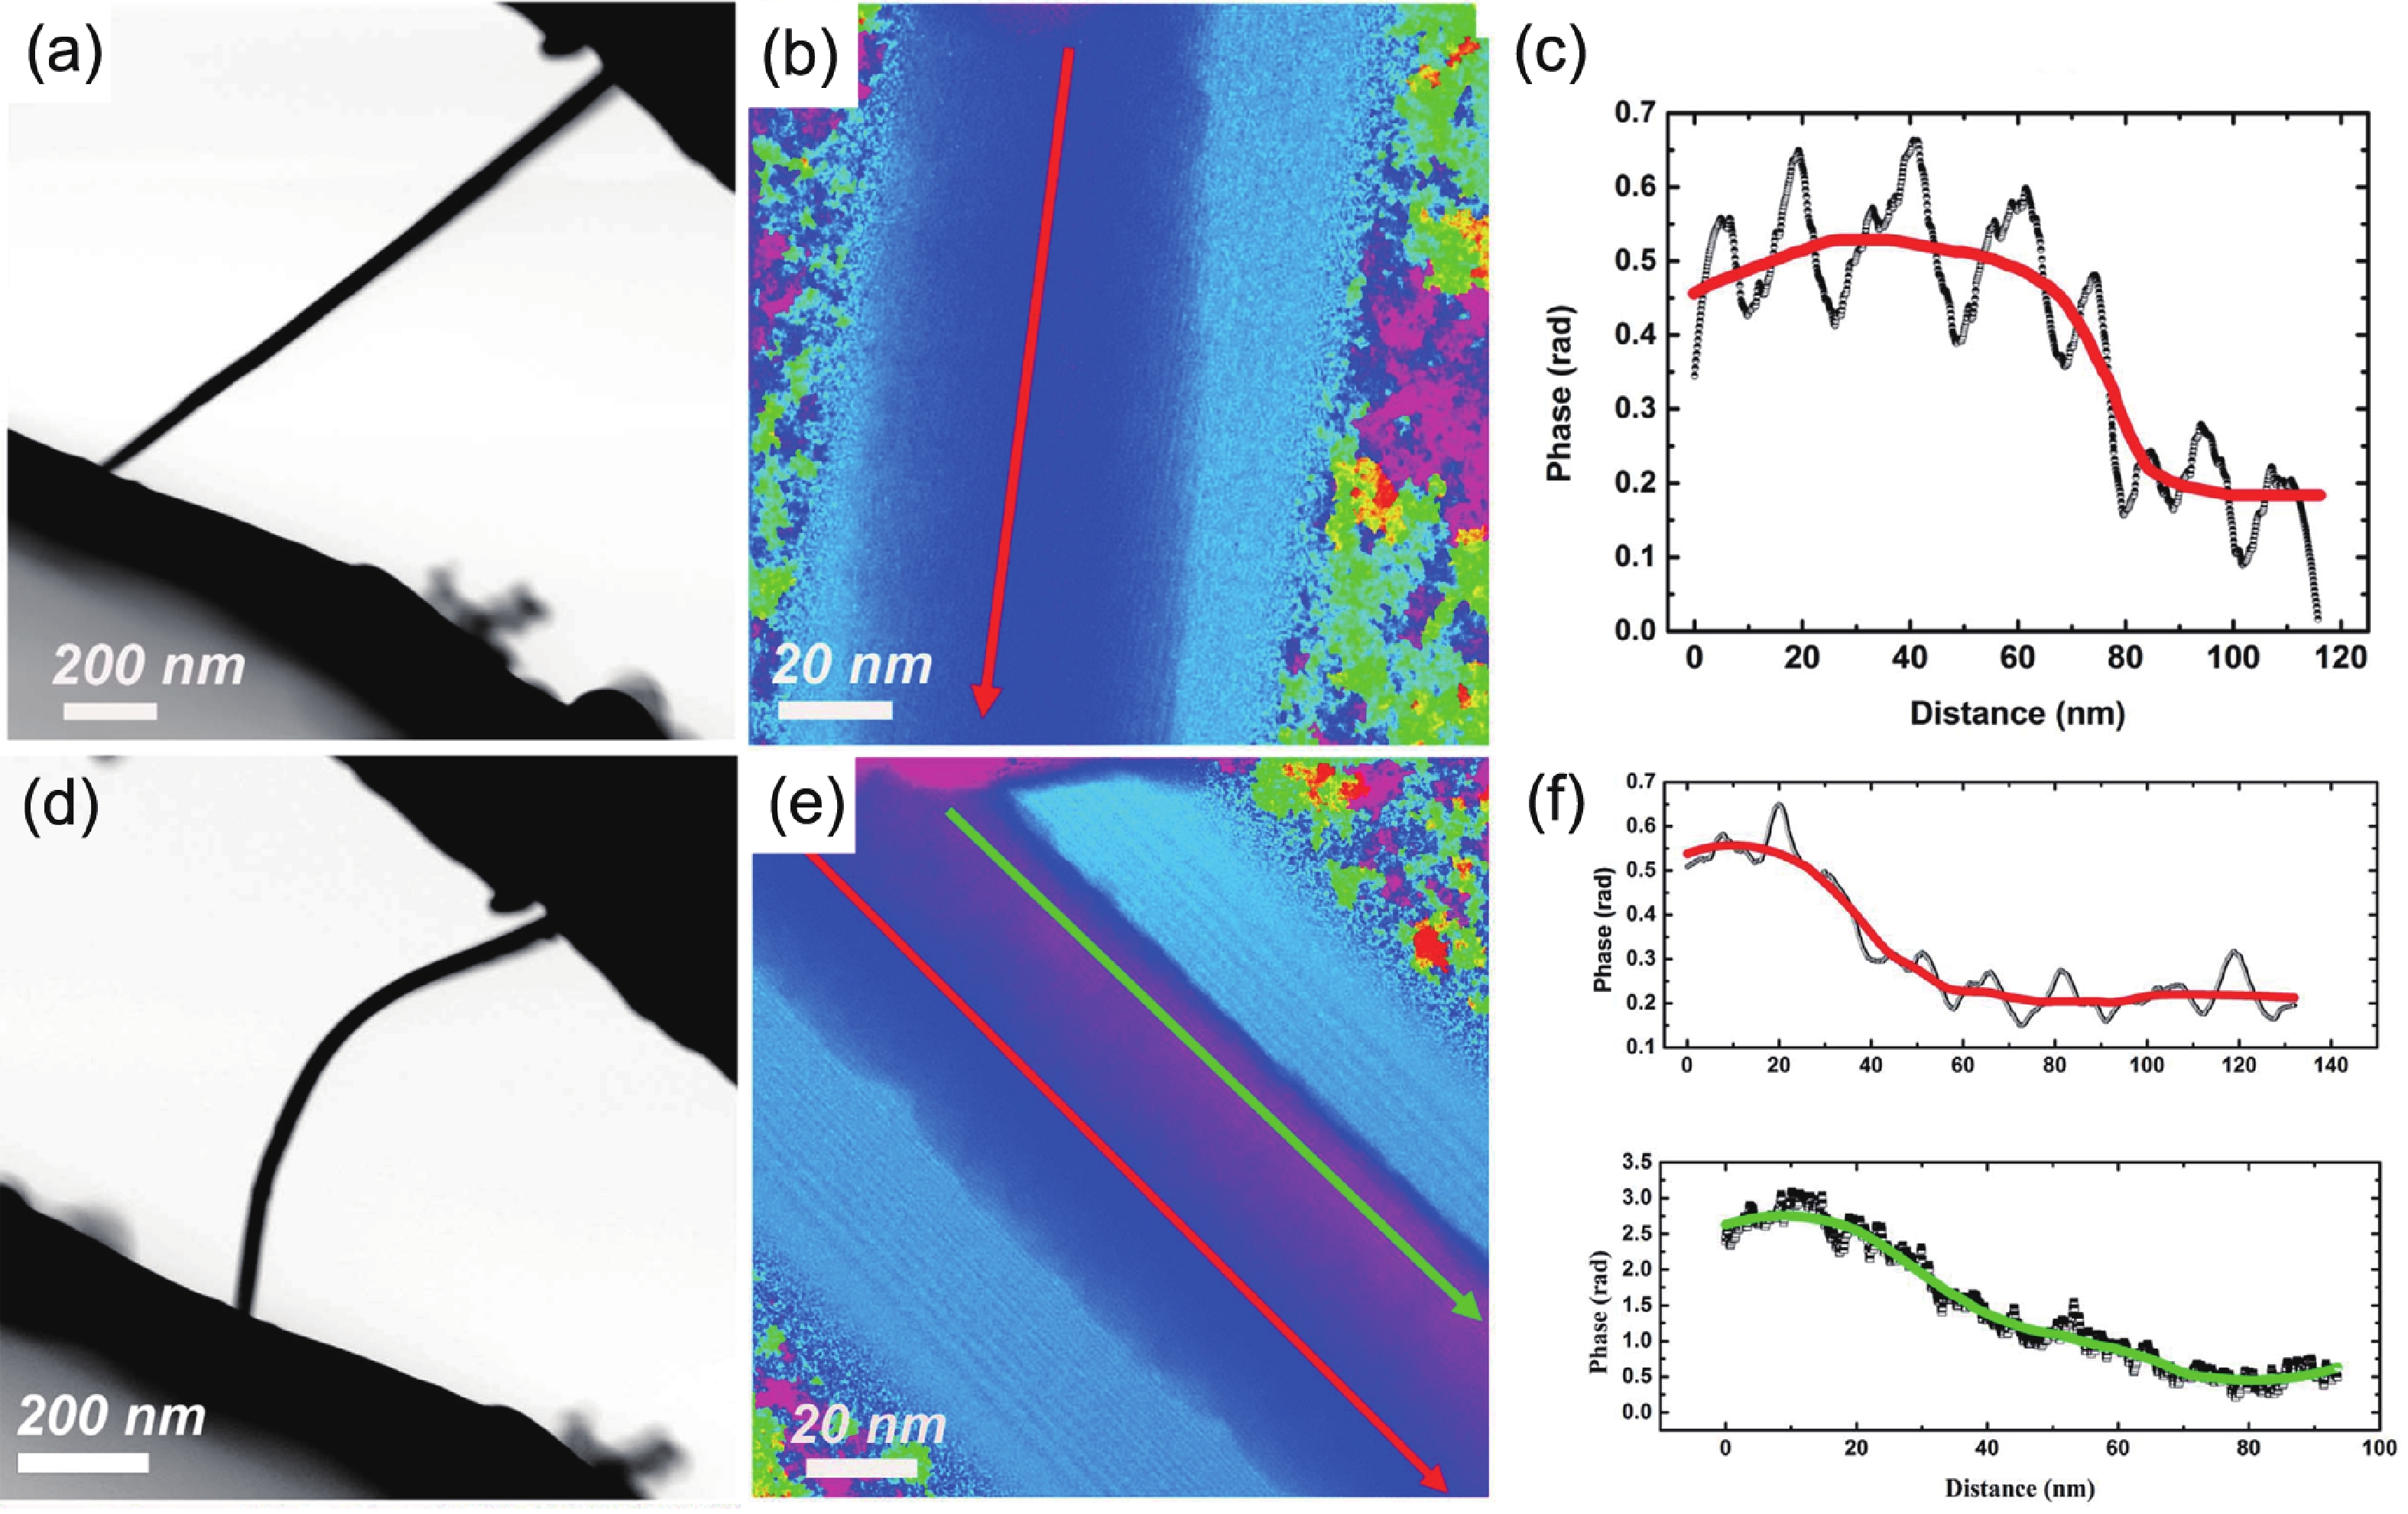
Fig. 5.  (Color online) (a) TEM image of specific straight GaN nanowire connected between two Au electrodes forming a closed electrical circuit. (b) Phase image of the straight GaN nanowire close to the M–S junction. (c) Phase shift line profile of the region labeled by a red line in (b), and the red line indicates average values of the phase shift profile. (d) TEM image of a bent GaN nanowire connected between two Au electrodes. (e) Phase image of the bent GaN nanowire at the M–S junction showing different phase contrasts along radial direction. (f) Phase shift line profiles along the red and green arrows, respectively. The red and green lines represent their average values[25].

Fig. 6.  (Color online) (a) Potential profiles at –5, –10 and –15 V bias, respectively. The inset shows corresponding phase image. The solid arrow labels the nanowire core for phase profiling, and the two dotted arrows indicate the vacuum regions on either side of the nanowire for phase profiling. (b) 3D calculations of the depletion width W using the Nextnano3 software. The selection of doping level ND = 1018 cm–3 and surface charge density Ns = 2.5 × 1012 cm–2 (green triangles) gives the best fit to the experimental depletion widths obtained by electron holography (black diamond)[27]. (c, d) Electron holographic phase images of the p–n and p–i–n heterojunctions, respectively. (e, f) The corresponding electrostatic potential profiles of p–n and p–i–n heterojunctions, respectively[28].

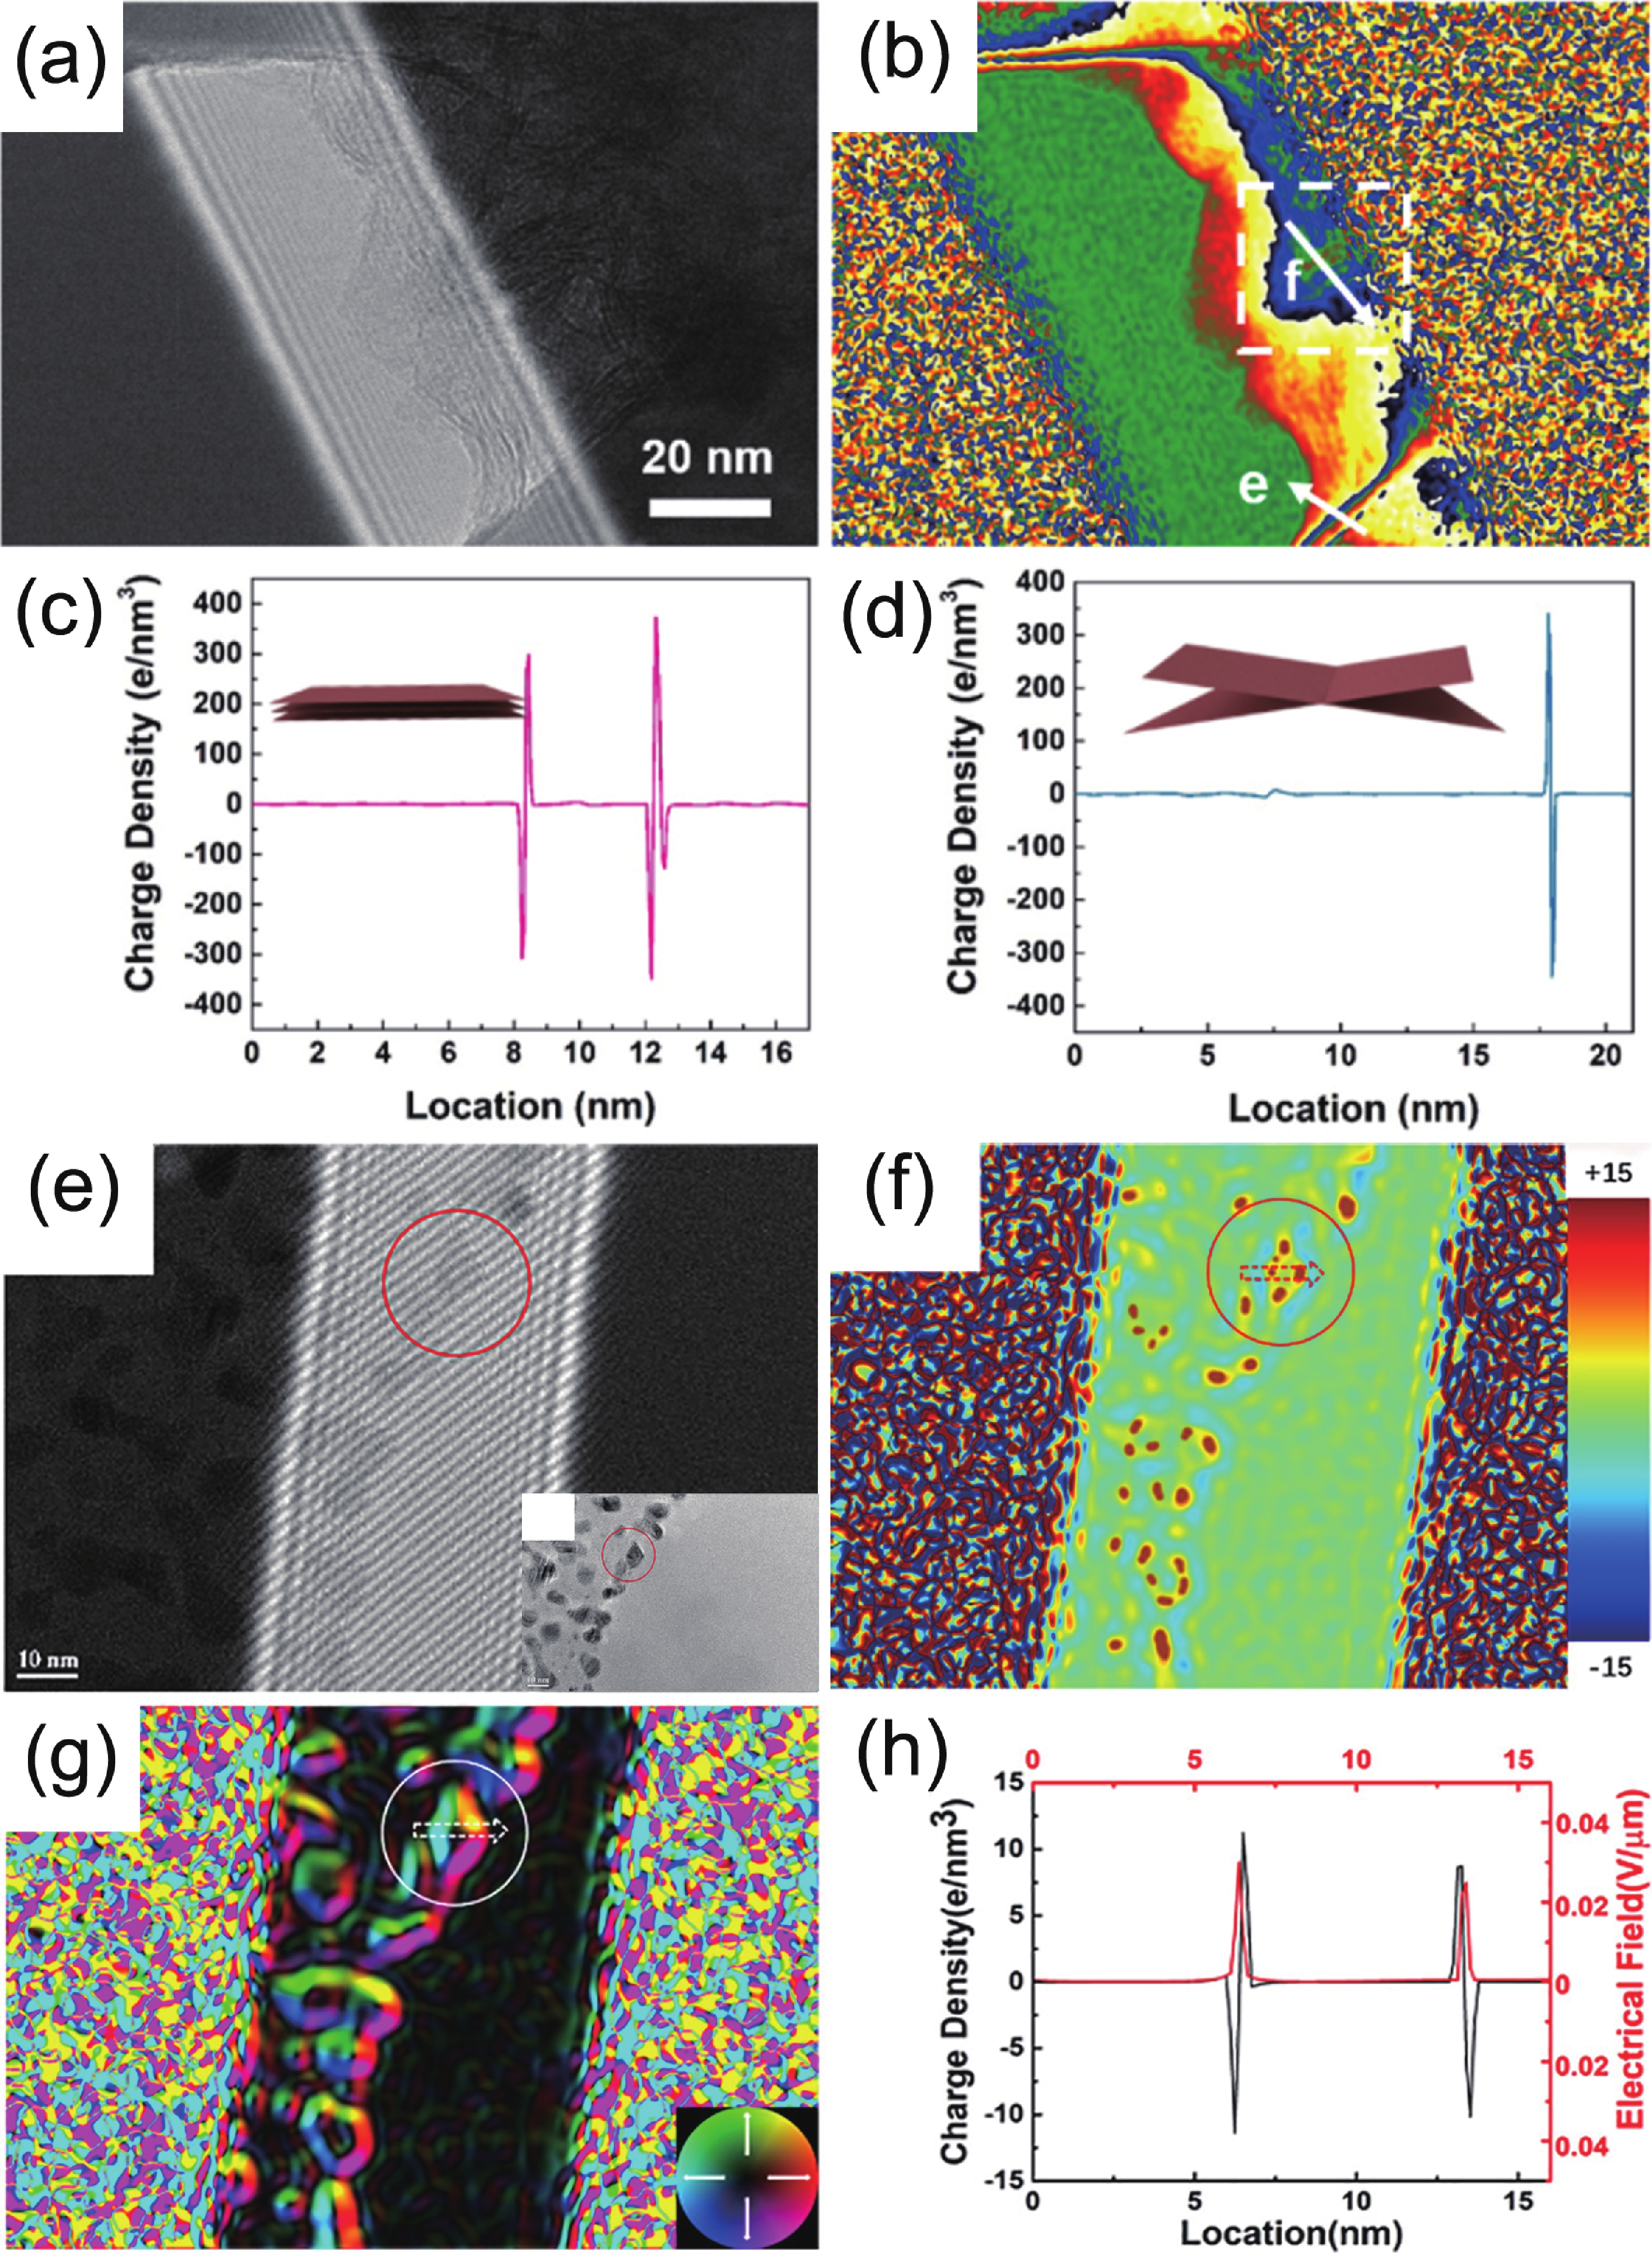
Fig. 7.  (Color online) (a) Electron hologram of MXene-MoS2 2D/2D heterostructure. (b) Corresponding charge density image. (c, d) Charge density line profiles corresponding to the white arrows labeled as (e) and (f), respectively[29]. (e) Electron hologram of MoS2/FeS2 heterojunction. (f) Corresponding charge density map and (g) electric field map. (h) Charge density line profile (black) and electric field line profile (red) corresponding to the region labeled by the red dotted arrow in (f) and white dotted arrow in (g), respectively[30].

[1]
Waldrop M M. The chips are down for Moore's law. Nature, 2016, 530, 144 doi: 10.1038/530144a
[2]
Li L, Gan Z, McCartney M R, et al. Atomic configurations at InAs partial dislocation cores associated with Z-shape faulted dipoles. Sci Rep, 2013, 3, 3229 doi: 10.1038/srep03229
[3]
Li L, Tu F, Jin L, et al. Polarity continuation and frustration in ZnSe nanospirals. Sci Rep, 2014, 4, 7447 doi: 10.1038/srep07447
[4]
Smith D J. Atomic-resolution structure imaging of defects and interfaces in compound semiconductors. Prog Cryst Growth Charact Mater, 2020, 66, 100498 doi: 10.1016/j.pcrysgrow.2020.100498
[5]
Bragg W L. Microscopy by reconstructed wave-fronts. Nature, 1950, 166, 399 doi: 10.1038/166399b0
[6]
Crewe A V, Isaacson M, Johnson D. A simple scanning electron microscope. Rev Sci Instrum, 1969, 40, 241 doi: 10.1063/1.1683910
[7]
Cowley J M. Twenty forms of electron holography. Ultramicroscopy, 1992, 41, 335 doi: 10.1016/0304-3991(92)90213-4
[8]
Li L Y, Hu X K, Gao Y H. Electron holographic study of semiconductor light-emitting diodes. Small, 2018, 14, 1701996 doi: 10.1002/smll.201701996
[9]
Lichte H, Formanek P, Lenk A, et al. Electron holography: Applications to materials questions. Annu Rev Mater Res, 2007, 37, 539 doi: 10.1146/annurev.matsci.37.052506.084232
[10]
McCartney M R, Gajdardziska-Josifovska M. Absolute measurement of normalized thickness, t/λ i, from off-axis electron holography. Ultramicroscopy, 1994, 53, 283 doi: 10.1016/0304-3991(94)90040-X
[11]
Gribelyuk M A, McCartney M R, Li J, et al. Mapping of electrostatic potential in deep submicron CMOS devices by electron holography. Phys Rev Lett, 2002, 89, 025502 doi: 10.1103/PhysRevLett.89.025502
[12]
den Hertog M I, Schmid H, Cooper D, et al. Mapping active dopants in single silicon nanowires using off-axis electron holography. Nano Lett, 2009, 9, 3837 doi: 10.1021/nl902024h
[13]
Li L Y, Smith D J, Dailey E, et al. Observation of hole accumulation in Ge/Si core/shell nanowires using off-axis electron holography. Nano Lett, 2011, 11, 493 doi: 10.1021/nl1033107
[14]
Gan Z F, Gu M, Tang J S, et al. Direct mapping of charge distribution during lithiation of Ge nanowires using off-axis electron holography. Nano Lett, 2016, 16, 3748 doi: 10.1021/acs.nanolett.6b01099
[15]
Zhou L, Smith D J, McCartney M R, et al. Measurement of electric field across individual wurtzite GaN quantum dots using electron holography. Appl Phys Lett, 2011, 99, 101905 doi: 10.1063/1.3636109
[16]
McCartney M R, Dunin-Borkowski R E, Smith D J. Quantitative measurement of nanoscale electrostatic potentials and charges using off-axis electron holography: Developments and opportunities. Ultramicroscopy, 2019, 203, 105 doi: 10.1016/j.ultramic.2019.01.008
[17]
Kern F, Linck M, Wolf D, et al. Autocorrected off-axis holography of two-dimensional materials. Phys Rev Res, 2020, 2, 043360 doi: 10.1103/PhysRevResearch.2.043360
[18]
Li L Y, Ketharanathan S, Drucker J, et al. Study of hole accumulation in individual germanium quantum dots in p-type silicon by off-axis electron holography. Appl Phys Lett, 2009, 94, 232108 doi: 10.1063/1.3154524
[19]
Gan Z F, Perea D E, Yoo J, et al. Characterization of electrical properties in axial Si-Ge nanowire heterojunctions using off-axis electron holography and atom-probe tomography. J Appl Phys, 2016, 120, 104301 doi: 10.1063/1.4962380
[20]
Cheng F, Li B, Li L Y, et al. Study of the polarization effect in InAs quantum dots/GaAs nanowires. J Phys Chem C, 2019, 123, 4228 doi: 10.1021/acs.jpcc.8b11425
[21]
Li C, Cheng Y F, Li B, et al. Study of charge distributions and electrical properties in GaAs/AlGaAs single quantum well/nanowire heterostructures. J Phys Chem C, 2019, 123, 26888 doi: 10.1021/acs.jpcc.9b06371
[22]
Qi T Y, Cheng Y F, Cheng F, et al. Study of nanometer-scale structures and electrostatic properties of InAs quantum dots decorating GaAs/AlAs core/shell nanowires. Nanotechnology, 2020, 31, 245701 doi: 10.1088/1361-6528/ab767e
[23]
den Hertog M, Songmuang R, Monroy E. Polarization fields in GaN/AlN nanowire heterostructures studied by off-axis holography. J Phys: Conf Ser, 2013, 471, 012019 doi: 10.1088/1742-6596/471/1/012019
[24]
Chen X, Wang Y G, Guo J, et al. In-situ potential mapping of space charge layer in GaN nanowires under electrical field by off-axis electron holography. Prog Nat Sci Mater Int, 2016, 26, 163 doi: 10.1016/j.pnsc.2016.03.009
[25]
Chen X, Wang Y G, Jian J K, et al. Effect of strain on space charge layer in GaN nanowires investigated by in situ off-axis electron holography. Prog Nat Sci Mater Int, 2017, 27, 186 doi: 10.1016/j.pnsc.2017.02.003
[26]
Chen X, Wang Y G, Jian J K, et al. Controlling charges distribution at the surface of a single GaN nanowire by in situ strain. Prog Nat Sci Mater Int, 2017, 27, 430 doi: 10.1016/j.pnsc.2017.06.007
[27]
den Hertog M, Donatini F, McLeod R, et al. In situ biasing and off-axis electron holography of a ZnO nanowire. Nanotechnology, 2018, 29, 025710 doi: 10.1088/1361-6528/aa923c
[28]
Jiang F, Chen J W, Bi H, et al. The underlying micro-mechanism of performance enhancement of non-polar n-ZnO/p-AlGaN ultraviolet light emitting diode with i-ZnO inserted layer. Appl Phys Lett, 2018, 112, 033505 doi: 10.1063/1.5010594
[29]
Li X, Wen C Y, Yang L T, et al. Enhanced visualizing charge distribution of 2D/2D MXene/MoS2 heterostructure for excellent microwave absorption performance. J Alloys Compd, 2021, 869, 159365 doi: 10.1016/j.jallcom.2021.159365
[30]
Xing L S, Li X, Wu Z C, et al. 3D hierarchical local heterojunction of MoS2/FeS2 for enhanced microwave absorption. Chem Eng J, 2020, 379, 122241 doi: 10.1016/j.cej.2019.122241
[31]
Kawasaki T, Takahashi Y, Tanigaki T. Holography: application to high-resolution imaging. Microscopy, 2020, 70, 39 doi: 10.1093/jmicro/dfaa050
[32]
Wolf D, Lubk A, Prete P, et al. 3D mapping of nanoscale electric potentials in semiconductor structures using electron-holographic tomography. J Phys D, 2016, 49, 364004 doi: 10.1088/0022-3727/49/36/364004
[33]
Liu L Z Y, McAleese C, Sridhara Rao D V, et al. Electron holography of an in situ biased GaN-based LED. Phys Status Solidi C, 2012, 9, 704 doi: 10.1002/pssc.201100486
[34]
Yazdi S, Kasama T, Beleggia M, et al. Towards quantitative electrostatic potential mapping of working semiconductor devices using off-axis electron holography. Ultramicroscopy, 2015, 152, 10 doi: 10.1016/j.ultramic.2014.12.012
  • Search

    Advanced Search >>

    GET CITATION

    shu

    Export: BibTex EndNote

    Article Metrics

    Article views: 1405 Times PDF downloads: 127 Times Cited by: 0 Times

    History

    Received: 06 November 2021 Revised: 10 February 2022 Online: Accepted Manuscript: 29 March 2022Uncorrected proof: 29 March 2022Published: 18 April 2022

    Catalog

      Email This Article

      User name:
      Email:*请输入正确邮箱
      Code:*验证码错误
      Luying Li, Yongfa Cheng, Zunyu Liu, Shuwen Yan, Li Li, Jianbo Wang, Lei Zhang, Yihua Gao. Study of structure-property relationship of semiconductor nanomaterials by off-axis electron holography[J]. Journal of Semiconductors, 2022, 43(4): 041103. doi: 10.1088/1674-4926/43/4/041103 ****Luying Li, Yongfa Cheng, Zunyu Liu, Shuwen Yan, Li Li, Jianbo Wang, Lei Zhang, Yihua Gao, Study of structure-property relationship of semiconductor nanomaterials by off-axis electron holography[J]. Journal of Semiconductors, 2022, 43(4), 041103 doi: 10.1088/1674-4926/43/4/041103
      Citation:
      Luying Li, Yongfa Cheng, Zunyu Liu, Shuwen Yan, Li Li, Jianbo Wang, Lei Zhang, Yihua Gao. Study of structure-property relationship of semiconductor nanomaterials by off-axis electron holography[J]. Journal of Semiconductors, 2022, 43(4): 041103. doi: 10.1088/1674-4926/43/4/041103 ****
      Luying Li, Yongfa Cheng, Zunyu Liu, Shuwen Yan, Li Li, Jianbo Wang, Lei Zhang, Yihua Gao, Study of structure-property relationship of semiconductor nanomaterials by off-axis electron holography[J]. Journal of Semiconductors, 2022, 43(4), 041103 doi: 10.1088/1674-4926/43/4/041103

      Study of structure-property relationship of semiconductor nanomaterials by off-axis electron holography

      DOI: 10.1088/1674-4926/43/4/041103
      More Information
      • Luying Li:received her Master degree in 2006 in Physics Department of Wuhan University, and Ph.D. in 2011 in Physics Department of Arizona State University. She started to work in Wuhan National Laboratory for Optoelectronics in Huazhong University of Science and Technology in Dec, 2011. Her current research interest is about the relationship between atomic structures and specific physical properties of semiconductor nanomaterials, focusing on their electrostatic and in-situ properties at atomic resolution
      • Corresponding author: luying.li@hust.edu.cn
      • Received Date: 2021-11-06
      • Revised Date: 2022-02-10
      • Available Online: 2022-03-29

      Catalog

        /

        DownLoad:  Full-Size Img  PowerPoint
        Return
        Return