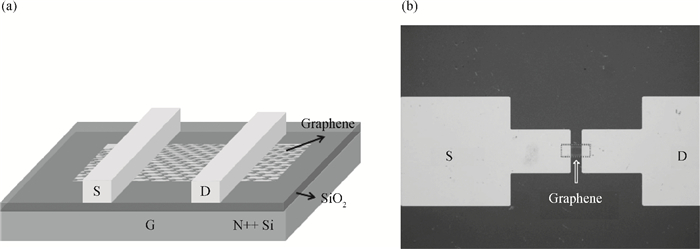
J. Semicond. > 2014, Volume 35 > Issue 9 > 094003

SEMICONDUCTOR DEVICES

Hysteresis analysis of graphene transistor under repeated test and gate voltage stress

Jie Yang1, , Kunpeng Jia1, Yajuan Su1, , Yang Chen2 and Chao Zhao1

+ Author Affiliations

 Corresponding author: Jie Yang, yangjie11@mails.ucas.ac.cn; Su Yajuan, Email:suyajuan@ime.ac.cn

DOI: 10.1088/1674-4926/35/9/094003

PDF

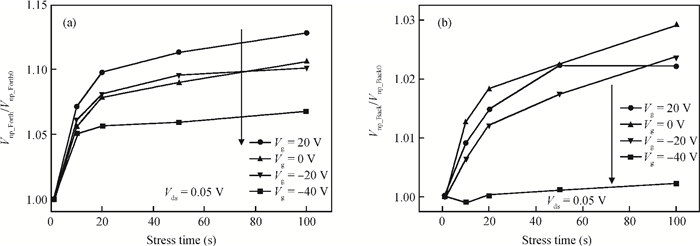
Abstract: The current transport characteristic is studied systematically based on a back-gate graphene field effect transistor, under repeated test and gate voltage stress. The interface trapped charges caused by the gate voltage sweep process screens the gate electric field, and results in the neutral point voltage shift between the forth and back sweep direction. In the repeated test process, the neutral point voltage keeps increasing with test times in both forth and back sweeps, which indicates the existence of interface trapped electrons residual and accumulation. In gate voltage stress experiment, the relative neutral point voltage significantly decreases with the reducing of stress voltage, especially in -40 V, which illustrates the driven-out phenomenon of trapped electrons under negative voltage stress.

Key words: graphene FETinterface trapelectrical measurementrepeated teststress

Graphene, the two-dimension material first found in 2004[1], has attracted large numbers of researchers due to its unique properties. The properties such as high mobility[2], optical transparency[3] and its single atom layer carbon structure make graphene have great potential in industrial applications and scientific research. Graphene-based functional devices were fabricated within a few years, such as flexible displays[4], RF devices[5] and electrodes[6].

The graphene based field effect transistor (FET) has been a hot topic as a fundamental device of circuit applications. The high mobility and thermal conductance lead this material to be an ideal candidate to replace or complement conventional silicon as the basic material in integrated circuits. However, there are many critical issues needing to be solved in the road to graphene logic devices. Besides band gap opening[7] and controllable doping of the graphene channel[8], stability of graphene devices[9] is also an important challenge for applications of graphene FET. As single layer graphene is an all-surface material, the stability of graphene FET is sensitive to its surface and interface conditions, which depend on the adsorption in the air, the quality of the substrate interface and the processing contamination. Hysteresis behavior, mainly caused by the graphene surface and interface charges, is a typical phenomenon in transfer characteristic curves of graphene FET under natural ambient circumstances. In many studies, hysteretic behavior has been studied under various interfaces (water[10], polymer[11], dangling[12]) and follow-up processes (in the air[13], under dry oxygen[14], annealing[14]). These works show that the hysteretic phenomenon has much dependence on the surface and ambient conditions of graphene FET.

In this work, we studied the affect of the electrical test behavior on the electrical performance of graphene FET. Back gate graphene FET on SiO2/Si substrate was fabricated and its hysteresis behavior of the drain current versus the gate voltage (the ${I_{\text{d}}}{\text{ - }}{{\text{V}}_{\text{g}}}$) curve was studied. The hysteresis parameters were compared in different back gate sweep ranges, in a repeated test process and under different stress voltages. The interface trapped electrons residual and its accumulation between different test-times were observed during the test, which indicated that the electrical measurement could bring an unrecoverable impact to the electrical performance of graphene FET. The driven-out phenomenon of interface trapped electrons has also been detected under negative gate voltage stress. This work provides a deeper insight into the interface of graphene/SiO2 and ways to optimize graphene FET electrical performance.

The studied device is a graphene channel FET, isolated by the dielectric layer of silicon oxide on the N-type silicon substrate. Figure 1(a) shows the structure schematic diagram of the graphene FET. The graphene was synthesized by chemical vapor deposition (CVD) on copper film and then coated with PMMA to support graphene in the following etching and transfer process. The copper substrate was removed by the wet etching process and PMMA/graphene was transferred onto the silicon substrate with 100 nm CVD silicon oxide as the dielectric. After the cleaning of PMMA with an acetone solution, the drain/source (S/D) areas were patterned by optical lithography and followed with thermal evaporation 10 nm Cr and 90 nm Au. With the lift-off process, the S/D metal electrodes were left precisely on the surface of graphene. In order to etch the graphene channel, the second lithography was used with oxygen plasma.

Figure  1.  (a) Structure schematic diagram and (b) optical microscope graph of graphene field effect transistor, ${W}{\text{/}}{L}{\text{ = 10 }}\mu {\text{m/10 }}\mu {\text{m}}$.

Figure 1(b) shows the optical microscope graph of graphene FET, which indicates that the sample is relatively clean and the S/D metal is well patterned after the lift-off process.

Raman spectrums of both transferred and processed graphene by using the 473 nm laser are shown in Fig. 2. The D peak is insignificant in Fig. 2(a), confirming the integrity of the graphene material after transfer. The inset graph in Fig. 2(a) shows the graphene 2D curve fitted well with a single peak lorentz curve, which confirms the graphene has a single layer[15]. In Fig. 2(b), the G-peak and 2D-peak shift right to 1593 cm-1 and 2714 cm-1, respectively after the processes, which indicates that the graphene channel is highly P-doped[16]. The channel P-doped property was also observed in the late electrical measurement. The high doping suppressed the intensity of the 2D peak and resulted in the decreasing of ${I_{{\text{2D}}}}/{I_{\text{G}}}$ (from 2.44 in the transferred graphene to 1.03 in the processed graphene).

Figure  2.  (a) Raman spectrum for transferred graphene before processing. The inset shows the 2D peak and its Lorentz fit confirms that the studied graphene is a single atom layer. (b) Raman spectrum for graphene after processing, which indicates the graphene has been highly doped.

The electrical characteristic of graphene FET was measured by using an Agilent 4156 semiconductor analyzer at room temperature and in air. Figure 3(a) shows a typical drain current versus the gate voltage (${I_{\text{d}}}{\text{ - }}{{\text{V}}_{\text{g}}}$) sweep curve of the back gate graphene FET. The gate voltage sweeps from -10 to 100 V and then sweeps back to -10 V. Drain and source voltages stay in 0.05 and 0 V. The forth and back sweep curve has a different charge neutral point (corresponding to minimum conductivity), which coincides with the Dirac point of graphene. The drain current and gate voltage in the charge neutral points are defined as ${I_{{\text{dnp}}}}_{\_{\text{Forth}}}$ & ${V_{{\text{np}}\_{\text{Forth}}}}$ in the forth sweep, and ${I_{{\text{dnp}}}}_{\_{\text{Back}}}$ & ${V_{{\text{np}}\_{\text{Back}}}}$ in the back sweep.

As in Fig. 3(a), the charge neutral point voltages are both over 70 V, which indicates the graphene has been highly P-doped, which is also confirmed from the conclusion of the above Raman measurement. The intrinsic P-doping of graphene is mainly caused by the hole doping from the adsorbed water and oxygen molecules[9] or contamination on the graphene surface[17]. It is obvious that there is a positive shift of the charge neutral point voltage in the back sweep compared with the forth process. This shift is mainly caused by the electrical screening effect originating from the trapped charges in the graphene/SiO2 interface[10]. Figure 3(c) shows the schematic diagram of the screen effect from the interface traps. With the back gate sweeping in positive voltage, electrons in the graphene channel are gradually accumulated into the graphene/SiO2 interface trap center. The electrons under the graphene partly screen the positive back gate electric field, which results in decreasing the electric potential of the graphene. Consequently, the voltage at the neutral point shifts up to offset the screened electric field.

Figure  3.  (a) Typical transfer curve of graphene FET at room temperature and in air. (b) The voltage shift with different gate voltage sweep ranges. (c) Schematic diagram of the electrical hysteresis caused by interface trap charges screen effect

To study the influence of electrical measurement on graphene FET electrical performance, the relation between neutral point voltage shifts $\Delta {V_{{\text{np}}}}({\text{equals}}\;{\text{to}}\;{V_{{\text{np}}\_{\text{Back}}}} - {V_{{\text{np}}\_{\text{Forth}}}})$ with the gate voltage sweep range was studied, as shown in Fig. 3(b). The $\Delta {V_{{\text{np}}}}$ reaches as 10.7 V / 7.7 V/6 V at 0-100 V / 70-100 V / 80-100 V sweep ranges, respectively. The $\Delta {V_{{\text{np}}}}$ decreases with the reducing of the ${V_{\text{g}}}$ sweep range in the positive domain. The shift decrease is caused by the different density of captured electrons inducing a different screen effect. This phenomenon clearly shows the electrical measurement itself having a significant impact on the test result.

To further understand the impact of the electrical test, the studied device is tested repeatedly under different recovery times (10, 10, 30, 50, 100, 300 and 500 s). The stress module of the Agilent analyzer is taken as the measurement equipment, which keeps the stress voltages at zero and the stress time equaling the recovery time. The extracted neutral point voltage ${V_{{\text{np}}}}$ and its shift $\Delta {V_{{\text{np}}}}$ are shown in Fig. 4(a), where the square and circle curves represent the neutral point voltage in the forth sweep and the back sweep. The ${V_{{\text{np}}}}$ always keep increasing with the repeated test times in both the forth and back sweeps, even after the recovery time of 500 s. It can be explained that the trapped electrons in the graphene/SiO2 interface have not been released completely at the end of each test. The residual interface electrons, which can stay in traps over 500 s, will continuously accumulate and enhance the electrical field screening effect in the next test process, and ultimately lead to the raising of ${V_{{\text{np}}}}$. The down-triangle curve with the right axis in Fig. 4(a) stands for $\Delta {V_{{\text{np}}}}$ versus different test times, shows $\Delta {V_{{\text{np}}}}$ decreases with the increasing of test times. It is obvious that $\Delta {V_{{\text{np}}}}$ is caused by the difference of the interface charge number, just as:

$ \Delta {V_{{\text{np}}}} \propto {\text{ }}\Delta {Q_{{\text{it}}}} = {Q_{{\text{itB}}}} - {Q_{{\text{itF}}}}, $

(1)

where ${Q_{{\text{itB}}}}$ and ${Q_{{\text{itF }}}}$ are the interface trapped charge under back and forth sweep respectively, and $\Delta {Q_{{\text{it}}}}$ is the difference of trapped charges. Due to the limitation of interface trap sites, the gap of the trapped charge number between the forth and back sweeps shrinks with the increasing of residual interface electrons. Therefore, the voltage shift decreases with the growth of test times.

The drain current in neutral point ${I_{{\text{dnp}}}}$ and its shift $\Delta {I_{{\text{dnp}}}}$ have the same trend as the voltage, shown in Fig. 4(b). The ${I_{{\text{dnp}}}}$ in the forth and back sweep, which is shown as the square and circle curves, has direct proportion with the test times. Nevertheless, the current shift $\Delta {I_{{\text{dnp}}}}$ decreases with the repeated test times, shown as the down-triangle curve with the right axis in Fig. 4(b). A comparison of Fig. 4(a) with Fig. 4(b) illustrates that there are many similarities of the test times dependency relationship for neutral voltage and neutral drain current. The similar trend of neutral voltage and neutral drain current may be caused by the charge injection in the electrons trap/de-trap process[18]. The specific mechanism of the similarity needs further research.

Figure  4.  (a) Neutral point voltage and its shift changes under repeated electrical tests at different recovery time points (0, 10, 20, 50, 100, 200, 500 and 1000 s). (b) Neutral point drain current and its shift change under the same conditions.

The effect of gate voltage stress on graphene FET is depicted in Fig. 5. The studied devices are continuously under the gate stress voltage ranging from 20 to -40 V, the ${I_{\text{d}}}$ -${V_{\text{g}}}$ results are tested at the time of 0, 10, 20, 50 and 100 s, repeatedly. Figure 5 shows the relative change of ${V_{{\text{np}}}}$ in both forth and back sweeps. To eliminate the variation of electrical characteristics between the different test samples, all the neutral point voltages are modified into a relative value (divided by corresponding primary ${V_{{\text{np}}}}$ at the time of 0 s, ${V_{{\text{np}}\_{\text{Forth0}}}}\;{\text{or}}\;{{\text{V}}_{{\text{np}}\_{\text{Back0}}}})$. Figure 5(a) shows the relative ${V_{{\text{np}}}}$ change with the stress time in the forth sweep process and in Fig. 5(b) the back sweep process. The relative neutral point voltages are greater than 1, which indicates the ${V_{{\text{np}}}}$ in the forth sweep is shifted up, compared with the primary neutral point voltage. With the gate stress voltage reducing from 20 to -40 V, the relative ${V_{{\text{np}}}}$ has a significant decrease, especially in the stress of -40 V. This result denotes that when the gate stress voltage is negative, the interface trapped electrons are partly driven out under the stress period, and ultimately results in the suppression of the screen effect of interface trapped electrons (and vice versa for the positive stress voltage).

Figure  5.  Relative neutral point voltage changes under different gate voltage stresses in different durations. (a) Forth sweep. (b) Back sweep.

In summary, the studied graphene FET has initially been P-doped in the air by the absorption of water molecules or process contamination. For the P-type graphene FET, the interface trapped electrons (caused by the positive gate sweep voltage) partly screen the gate electrical field, which results in the neutral point voltage shift of graphene FET. The shift $\Delta {V_{{\text{np}}}}$ is inversely proportional to the positive ${V_{\text{g}}}$ sweep range, which indicates the test result has a strong dependence on the electrical measurement method. In the repeated test experiment, the continuous increasing of ${V_{{\text{np}}}}$ with test times shows the interface screen electrons have residual and can accumulate at the end of each test. The gate voltage stress experiment proves that the negative gate voltage stress has a significant impact on the driving out of the trapped electrons at the interface of graphene/SiO2, which results in the significant decreasing of neutral point voltage with the reducing of stress voltage.


[1]
Novoselov K S, Geim A K, Morozov S V, et al. Electric field effect in atomically thin carbon films. Science, 2004, 306:666 doi: 10.1126/science.1102896
[2]
Bolotin K I, Sikes K J, Jiang Z, et al. Ultrahigh electron mobility in suspended graphene. Solid-State Commun, 2008, 146:351 doi: 10.1016/j.ssc.2008.02.024
[3]
Nair R R, Blake P, Grigorenko A N, et al. Fine structure constant defines visual transparency of graphene. Science, 2008, 320:1308 doi: 10.1126/science.1156965
[4]
Bonaccorso F, Sun Z, Hasan T, et al. Graphene photonics and optoelectronics. Nat Photonics, 2010, 4:611 doi: 10.1038/nphoton.2010.186
[5]
Wu Y Q, Farmer D B, Valdes-Garcia A, et al. Record high RF performance for epitaxial graphene transistors. IEEE International Electron Devices Meeting (IEDM), 2011 http://ieeexplore.ieee.org/document/6131601/
[6]
Wang X, Zhi L J, Mullen K. Transparent, conductive graphene electrodes for dye-sensitized solar cells. Nano Lett, 2008, 8:323 doi: 10.1021/nl072838r
[7]
Hicks J, Tejeda A, Taleb-Ibrahimi A, et al. A wide-bandgap metal-semiconductor-metal nanostructure made entirely from graphene. Nat Phys, 2013, 9:49 http://www.nature.com/nphys/journal/v9/n1/full/nphys2487.html?foxtrotcallback=true
[8]
Chiu H Y, Perebeinos V, Lin Y M, et al. Controllable p-n junction formation in mono layer graphene using electrostatic substrate engineering. Nano Lett, 2010, 10:4634 doi: 10.1021/nl102756r
[9]
Yang Y X, Brenner K, Murali R. The influence of atmosphere on electrical transport in graphene. Carbon, 2012, 50:1727 doi: 10.1016/j.carbon.2011.12.008
[10]
Wang H M, Wu Y H, Cong C X, et al. Hysteresis of electronic transport in graphene transistors. Acs Nano, 2010, 4:7221 doi: 10.1021/nn101950n
[11]
Lafkioti M, Krauss B, Lohmann T, et al. Graphene on a hydrophobic substrate:doping reduction and hysteresis suppression under ambient conditions. Nano Lett, 2010, 10:1149 doi: 10.1021/nl903162a
[12]
Kim W, Javey A, Vermesh O, et al. Hysteresis caused by water molecules in carbon nanotube field-effect transistors. Nano Lett, 2003, 3:193 doi: 10.1021/nl0259232
[13]
Jia Kunpeng, Yang Jie, Su Yajuan, et al. Stability analysis of a back-gate graphene transistor in air environment. Journal of Semiconductors, 2013, 34:084004 doi: 10.1088/1674-4926/34/8/084004
[14]
Yang Y X, Murali R. Binding mechanisms of molecular oxygen and moisture to graphene. Appl Phys Lett, 2011, 98(9):093116 doi: 10.1063/1.3562317
[15]
Ferrari A C, Meyer J C, Scardaci V, et al. Raman spectrum of graphene and graphene layers. Phys Rev Lett, 2006, 97:187401 doi: 10.1103/PhysRevLett.97.187401
[16]
Das A, Pisana S, Chakraborty B, et al. Monitoring dopants by Raman scattering in an electrochemically top-gated graphene transistor. Nature Nanotechnology, 2008, 3:210 doi: 10.1038/nnano.2008.67
[17]
Moser J, Barreiro A, Bachtold A. Current-induced cleaning of graphene. Appl Phys Lett, 2007, 91:163513 doi: 10.1063/1.2789673
[18]
Liao Z M, Han B H, Zhou Y B, et al. Hysteresis reversion in graphene field-effect transistors. J Chem Phys, 2010, 133:044703 doi: 10.1063/1.3460798
Fig. 1.  (a) Structure schematic diagram and (b) optical microscope graph of graphene field effect transistor, ${W}{\text{/}}{L}{\text{ = 10 }}\mu {\text{m/10 }}\mu {\text{m}}$.

Fig. 2.  (a) Raman spectrum for transferred graphene before processing. The inset shows the 2D peak and its Lorentz fit confirms that the studied graphene is a single atom layer. (b) Raman spectrum for graphene after processing, which indicates the graphene has been highly doped.

Fig. 3.  (a) Typical transfer curve of graphene FET at room temperature and in air. (b) The voltage shift with different gate voltage sweep ranges. (c) Schematic diagram of the electrical hysteresis caused by interface trap charges screen effect

Fig. 4.  (a) Neutral point voltage and its shift changes under repeated electrical tests at different recovery time points (0, 10, 20, 50, 100, 200, 500 and 1000 s). (b) Neutral point drain current and its shift change under the same conditions.

Fig. 5.  Relative neutral point voltage changes under different gate voltage stresses in different durations. (a) Forth sweep. (b) Back sweep.

[1]
Novoselov K S, Geim A K, Morozov S V, et al. Electric field effect in atomically thin carbon films. Science, 2004, 306:666 doi: 10.1126/science.1102896
[2]
Bolotin K I, Sikes K J, Jiang Z, et al. Ultrahigh electron mobility in suspended graphene. Solid-State Commun, 2008, 146:351 doi: 10.1016/j.ssc.2008.02.024
[3]
Nair R R, Blake P, Grigorenko A N, et al. Fine structure constant defines visual transparency of graphene. Science, 2008, 320:1308 doi: 10.1126/science.1156965
[4]
Bonaccorso F, Sun Z, Hasan T, et al. Graphene photonics and optoelectronics. Nat Photonics, 2010, 4:611 doi: 10.1038/nphoton.2010.186
[5]
Wu Y Q, Farmer D B, Valdes-Garcia A, et al. Record high RF performance for epitaxial graphene transistors. IEEE International Electron Devices Meeting (IEDM), 2011 http://ieeexplore.ieee.org/document/6131601/
[6]
Wang X, Zhi L J, Mullen K. Transparent, conductive graphene electrodes for dye-sensitized solar cells. Nano Lett, 2008, 8:323 doi: 10.1021/nl072838r
[7]
Hicks J, Tejeda A, Taleb-Ibrahimi A, et al. A wide-bandgap metal-semiconductor-metal nanostructure made entirely from graphene. Nat Phys, 2013, 9:49 http://www.nature.com/nphys/journal/v9/n1/full/nphys2487.html?foxtrotcallback=true
[8]
Chiu H Y, Perebeinos V, Lin Y M, et al. Controllable p-n junction formation in mono layer graphene using electrostatic substrate engineering. Nano Lett, 2010, 10:4634 doi: 10.1021/nl102756r
[9]
Yang Y X, Brenner K, Murali R. The influence of atmosphere on electrical transport in graphene. Carbon, 2012, 50:1727 doi: 10.1016/j.carbon.2011.12.008
[10]
Wang H M, Wu Y H, Cong C X, et al. Hysteresis of electronic transport in graphene transistors. Acs Nano, 2010, 4:7221 doi: 10.1021/nn101950n
[11]
Lafkioti M, Krauss B, Lohmann T, et al. Graphene on a hydrophobic substrate:doping reduction and hysteresis suppression under ambient conditions. Nano Lett, 2010, 10:1149 doi: 10.1021/nl903162a
[12]
Kim W, Javey A, Vermesh O, et al. Hysteresis caused by water molecules in carbon nanotube field-effect transistors. Nano Lett, 2003, 3:193 doi: 10.1021/nl0259232
[13]
Jia Kunpeng, Yang Jie, Su Yajuan, et al. Stability analysis of a back-gate graphene transistor in air environment. Journal of Semiconductors, 2013, 34:084004 doi: 10.1088/1674-4926/34/8/084004
[14]
Yang Y X, Murali R. Binding mechanisms of molecular oxygen and moisture to graphene. Appl Phys Lett, 2011, 98(9):093116 doi: 10.1063/1.3562317
[15]
Ferrari A C, Meyer J C, Scardaci V, et al. Raman spectrum of graphene and graphene layers. Phys Rev Lett, 2006, 97:187401 doi: 10.1103/PhysRevLett.97.187401
[16]
Das A, Pisana S, Chakraborty B, et al. Monitoring dopants by Raman scattering in an electrochemically top-gated graphene transistor. Nature Nanotechnology, 2008, 3:210 doi: 10.1038/nnano.2008.67
[17]
Moser J, Barreiro A, Bachtold A. Current-induced cleaning of graphene. Appl Phys Lett, 2007, 91:163513 doi: 10.1063/1.2789673
[18]
Liao Z M, Han B H, Zhou Y B, et al. Hysteresis reversion in graphene field-effect transistors. J Chem Phys, 2010, 133:044703 doi: 10.1063/1.3460798
1

Analysis of morphological, structural and electrical properties of annealed TiO2 nanowires deposited by GLAD technique

B. Shougaijam, R. Swain, C. Ngangbam, T.R. Lenka

Journal of Semiconductors, 2017, 38(5): 053001. doi: 10.1088/1674-4926/38/5/053001

2

Improving the photocatalytic performance of TiO2 via hybridizing with graphene

K S Divya, Athulya K Madhu, T U Umadevi, T Suprabha, P. Radhakrishnan Nair, et al.

Journal of Semiconductors, 2017, 38(6): 063002. doi: 10.1088/1674-4926/38/6/063002

3

Dual material gate doping-less tunnel FET with hetero gate dielectric for enhancement of analog/RF performance

Sunny Anand, R.K. Sarin

Journal of Semiconductors, 2017, 38(2): 024001. doi: 10.1088/1674-4926/38/2/024001

4

Performance analysis of charge plasma based dual electrode tunnel FET

Sunny Anand, S. Intekhab Amin, R. K. Sarin

Journal of Semiconductors, 2016, 37(5): 054003. doi: 10.1088/1674-4926/37/5/054003

5

Electrical properties of Ge:Ga near the metal-insulator transition

M Errai, A El Kaaouachi, H El Idrissi

Journal of Semiconductors, 2015, 36(6): 062001. doi: 10.1088/1674-4926/36/6/062001

6

Mechanism of the self-changing parameters and characteristics in AlGaN/GaN high-electron mobility transistors after a step voltage stress

Lei Shi, Shiwei Feng, Kun Liu, Yamin Zhang

Journal of Semiconductors, 2015, 36(7): 074005. doi: 10.1088/1674-4926/36/7/074005

7

Effects of interface trap density on the electrical performance of amorphous InSnZnO thin-film transistor

Yongye Liang, Kyungsoo Jang, S. Velumani, Cam Phu Thi Nguyen, Junsin Yi, et al.

Journal of Semiconductors, 2015, 36(2): 024007. doi: 10.1088/1674-4926/36/2/024007

8

Effect of band gap energy on the electrical conductivity in doped ZnO thin film

Said Benramache, Okba Belahssen, Hachemi Ben Temam

Journal of Semiconductors, 2014, 35(7): 073001. doi: 10.1088/1674-4926/35/7/073001

9

AC-electronic and dielectric properties of semiconducting phthalocyanine compounds:a comparative study

Safa'a M. Hraibat, Rushdi M-L. Kitaneh, Mohammad M. Abu-Samreh, Abdelkarim M. Saleh

Journal of Semiconductors, 2013, 34(11): 112001. doi: 10.1088/1674-4926/34/11/112001

10

Solid State Physics View of Liquid State Chemistry——Electrical conduction in pure water

Binbin Jie, Chihtang Sah

Journal of Semiconductors, 2013, 34(12): 121001. doi: 10.1088/1674-4926/34/12/121001

11

Structural, morphological, dielectrical and magnetic properties of Mn substituted cobalt ferrite

S. P. Yadav, S. S. Shinde, A. A. Kadam, K. Y. Rajpure

Journal of Semiconductors, 2013, 34(9): 093002. doi: 10.1088/1674-4926/34/9/093002

12

Radiation effect on the optical and electrical properties of CdSe(In)/p-Si heterojunction photovoltaic solar cells

M. Ashry, S. Fares

Journal of Semiconductors, 2012, 33(10): 102001. doi: 10.1088/1674-4926/33/10/102001

13

Characterization of electrical properties of AlGaN/GaN interface using coupled Schrödinger and Poisson equation

S. Das, A. K. Panda, G. N. Dash

Journal of Semiconductors, 2012, 33(11): 113001. doi: 10.1088/1674-4926/33/11/113001

14

Optical and electrical properties of porous silicon layer formed on the textured surface by electrochemical etching

Ou Weiying, Zhao Lei, Diao Hongwei, Zhang Jun, Wang Wenjing, et al.

Journal of Semiconductors, 2011, 32(5): 056002. doi: 10.1088/1674-4926/32/5/056002

15

NTC and electrical properties of nickel and gold doped n-type silicon material

Dong Maojin, Chen Zhaoyang, Fan Yanwei, Wang Junhua, Tao Mingde, et al.

Journal of Semiconductors, 2009, 30(8): 083007. doi: 10.1088/1674-4926/30/8/083007

16

Influence of zinc phthalocyanines on photoelectrical properties of hydrogenated amorphous silicon

Zhang Changsha, Zeng Xiangbo, Peng Wenbo, Shi Mingji, Liu Shiyong, et al.

Journal of Semiconductors, 2009, 30(8): 083004. doi: 10.1088/1674-4926/30/8/083004

17

Structural and electrical characteristics of lanthanum oxide gate dielectric film on GaAs pHEMT technology

Wu Chia-Song, Liu Hsing-Chung

Journal of Semiconductors, 2009, 30(11): 114004. doi: 10.1088/1674-4926/30/11/114004

18

Structure for Electrical Measurement of the Thermal Expansion Coefficient of Polysilicon Thin Films

Hu Dongmei, Huang Qing'an, Li Weihua

Journal of Semiconductors, 2008, 29(10): 2018-2022.

19

Analysis of PTCDA/ITO Surface and Interface Using X-ray Photoelectron Spectroscopy and Atomic Force Microscopy

Tang Ning, Shen Bo, Wang Maojun, Yang Zhijian, Xu Ke, et al.

Chinese Journal of Semiconductors , 2006, 27(2): 235-238.

20

Analysis of PTCDA/ITO Surface and Interface Using X-ray Photoelectron Spectroscopy and Atomic Force Microscopy

Ou Guping, Song Zhen, Gui Wenming, Zhang Fujia

Chinese Journal of Semiconductors , 2006, 27(2): 229-234.

  • Search

    Advanced Search >>

    GET CITATION

    Jie Yang, Kunpeng Jia, Yajuan Su, Yang Chen, Chao Zhao. Hysteresis analysis of graphene transistor under repeated test and gate voltage stress[J]. Journal of Semiconductors, 2014, 35(9): 094003. doi: 10.1088/1674-4926/35/9/094003
    J Yang, K P Jia, Y J Su, Y Chen, C Zhao. Hysteresis analysis of graphene transistor under repeated test and gate voltage stress[J]. J. Semicond., 2014, 35(9): 094003. doi: 10.1088/1674-4926/35/9/094003.
    shu

    Export: BibTex EndNote

    Article Metrics

    Article views: 2912 Times PDF downloads: 46 Times Cited by: 0 Times

    History

    Received: 24 January 2014 Revised: 21 March 2014 Online: Published: 01 September 2014

    Catalog

      Email This Article

      User name:
      Email:*请输入正确邮箱
      Code:*验证码错误
      Jie Yang, Kunpeng Jia, Yajuan Su, Yang Chen, Chao Zhao. Hysteresis analysis of graphene transistor under repeated test and gate voltage stress[J]. Journal of Semiconductors, 2014, 35(9): 094003. doi: 10.1088/1674-4926/35/9/094003 ****J Yang, K P Jia, Y J Su, Y Chen, C Zhao. Hysteresis analysis of graphene transistor under repeated test and gate voltage stress[J]. J. Semicond., 2014, 35(9): 094003. doi: 10.1088/1674-4926/35/9/094003.
      Citation:
      Jie Yang, Kunpeng Jia, Yajuan Su, Yang Chen, Chao Zhao. Hysteresis analysis of graphene transistor under repeated test and gate voltage stress[J]. Journal of Semiconductors, 2014, 35(9): 094003. doi: 10.1088/1674-4926/35/9/094003 ****
      J Yang, K P Jia, Y J Su, Y Chen, C Zhao. Hysteresis analysis of graphene transistor under repeated test and gate voltage stress[J]. J. Semicond., 2014, 35(9): 094003. doi: 10.1088/1674-4926/35/9/094003.

      Hysteresis analysis of graphene transistor under repeated test and gate voltage stress

      DOI: 10.1088/1674-4926/35/9/094003
      Funds:

      the National Science and Technology Major Project 2011ZX02707

      Project supported by the National Science and Technology Major Project (No. 2011ZX02707)

      More Information

      Catalog

        /

        DownLoad:  Full-Size Img  PowerPoint
        Return
        Return