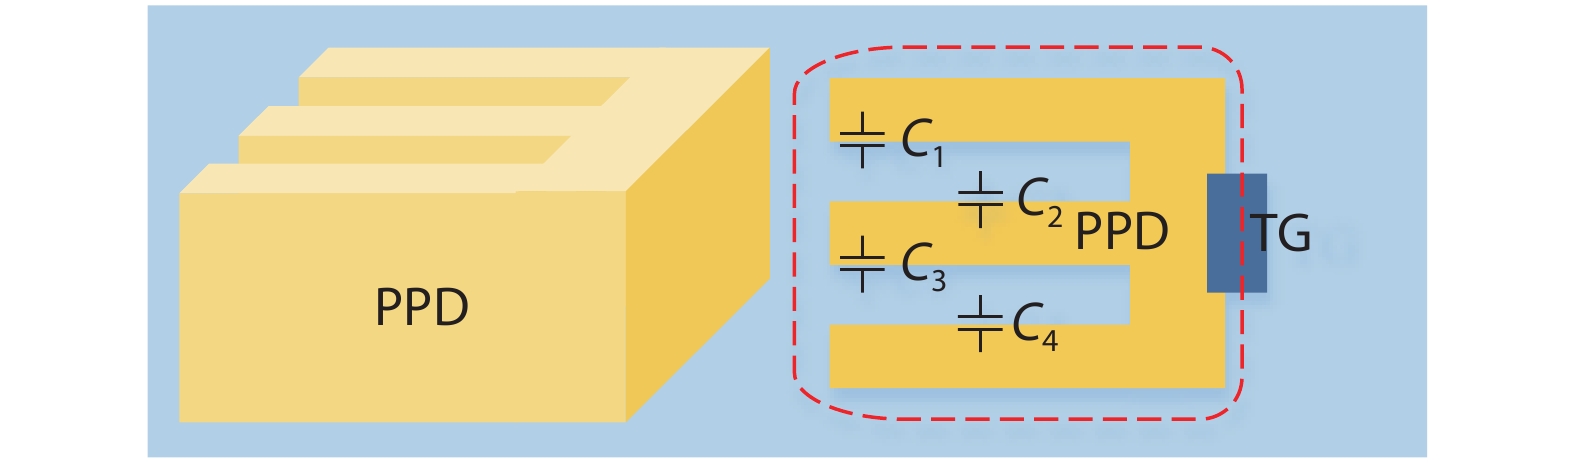
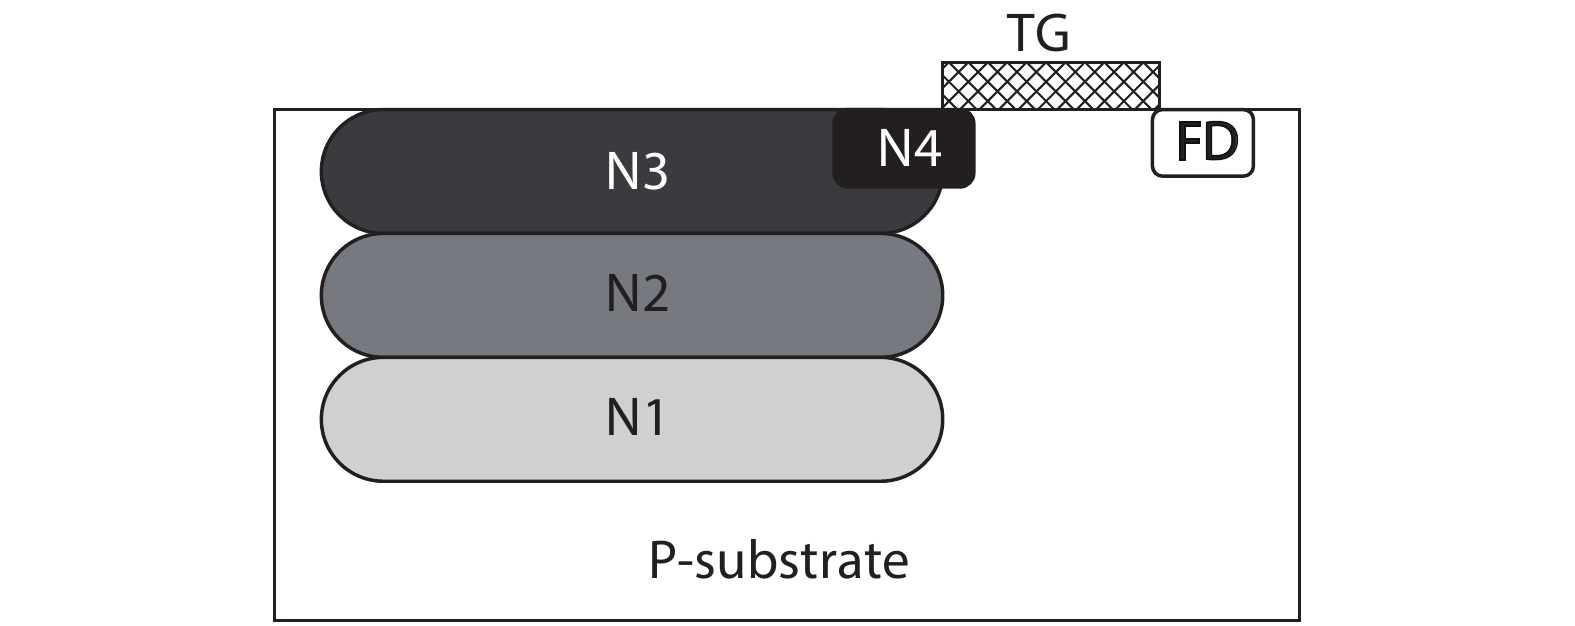
Processing math: 100%
J. Semicond. > 2020, Volume 41 > Issue 10 > 102301

ARTICLES

Design of CMOS active pixels based on finger-shaped PPD

Feng Li1, Ruishuo Wang1, Liqiang Han2 and Jiangtao Xu1,

+ Author Affiliations

 Corresponding author: Jiangtao Xu, Email: xujiangtao@tju.edu.cn

DOI: 10.1088/1674-4926/41/10/102301

PDF

Turn off MathJax

Abstract: To improve the full-well capacity and linear dynamic range of CMOS image sensor, a special finger-shaped pinned photodiode (PPD) is designed. In terms of process, the first N-type ion implantation of the PPD N buried layer is extended under the transfer gate, thereby increasing the PPD capacitance. Based on TCAD simulation, the width and spacing of PPD were precisely adjusted. A high full-well capacity pixel design with a pixel size of 6 × 6 μm2 is realized based on the 0.18 μm CMOS process. The simulation results indicate that the pixel with the above structure and process has a depletion depth of 2.8 μm and a charge transfer efficiency of 100%. The measurement results of the test chip show that the full-well capacity can reach 68650e. Compared with the conventional structure, the proposed PPD structure can effectively improve the full well capacity of the pixel.

Key words: CMOS active pixelfull well capacityfull depletion

In recent years, Ⅲ-V group nanowires (NWs) have attracted increasing attention because of their special geometrical characteristics, and unique electronic and optical properties for applications in nanometer-scale devices[1-5]. Among them, GaAs NWs have been extensively studied due to their direct bandgap and high optical performance, which in combination make them suitable for nano-optoelectronic devices, such as solar cells, photodetectors, and light-emitting diodes[6-10]. To date, a great deal of work has been done to grow GaAs NWs via a vapor-liquid-solid (VLS) method using Au-catalyzed[11-17] and Ga self-catalyzed[18-24] growth modes. The realization of the morphology and structure control is one of the most important issues in these studies. Careful manipulation of the morphology and structure of GaAs NWs will enhance the performance of future GaAs-based devices, including heterostructure devices and may also give access to interesting physics. Many factors affect on the morphology and structure of GaAs NWs and among them some key parameters have been tuned to control GaAs NW growth. For example, carefully selected Ga and As fluxes were employed to control the diameter and growth rate of GaAs NWs[18, 24, 25]. In the meantime, finely tuned growth temperature was shown to achieve high uniformity and desirable density of GaAs NWs[26, 27]. Different substrate orientations were also adopted for different growth directions of GaAs NWs[28-31]. In the previous work, by choosing appropriate As flux and opening and closing the Ga cell shutter during NW growth, we have obtained various combinations of wurtzite (WZ), zinc blende (ZB), and defect-section (DS) in a single GaAs NW, whose length is determined by the duration of opening or closing the Ga shutter[24]. All these aforementioned tunings for growth were made during or before GaAs NW growth. However, significantly, the cell shutter closing sequence that happens at the end of the growth could influence the morphology and structure of GaAs NWs at their tips, which is the NWs growth front. To the best of our knowledge, this important factor for GaAs NW growth has not been systematically investigated yet.

In this paper, self-catalyzed GaAs NWs are grown on Si (111) substrates by molecular-beam epitaxy (MBE). At the end of the GaAs NW growth, the Ga and As cell shutters are closed with different sequences and the effect of the cell shutter closing sequence on the morphology and structural phase of self-catalyzed GaAs NWs is investigated. When the growth of GaAs NWs is terminated by closing the Ga and As cell shutters simultaneously and by closing the Ga cell shutter first and then closing the As cell shutter 1 minute later, we find that the respective obtained GaAs NWs with and without Ga droplets can both keep vertical growth, and their structural phase transitions at the top of NWs follow the triple-phase-line (TPL) shift mode. GaAs NWs are also grown on Si (111) substrates with different Ga flux existing times after closing the As cell shutter. We find that these cell shutter closing sequences result in the growth direction of GaAs NW changing from [111] to non-[111]. Illustrations of the morphology evolution of GaAs NWs are provided and the structural phase transition at the end part of these GaAs NWs is also investigated, which confirms that the TPL shift mode is available even for the growth terminated with different Ga flux existing times. Our work will provide useful information for better understanding of the growth mechanism and realizing the morphology and structure control of GaAs NWs.

GaAs NWs were grown in a solid source MBE system (VG 80). Commercial p-type Si (111) wafers were used as the substrates. Before being loaded into the MBE chamber, the Si substrates were pretreated by chemical etching. At first, we removed the native oxidized layer completely using a HF solution (5%). Then, the substrates were coated with a new oxidized layer by dipping the Si substrate in a solution of H2SO4 (98%) and H2O2 (30%) (volume ratio = 4 : 1)[5, 27]. Finally, they were rinsed with deionized H2O and dried by a nitrogen gas stream. GaAs NWs were grown directly on Si (111) substrates via a self-catalyzed growth manner. The growth of GaAs NWs was commenced by opening the Ga cell shutter for 8 s and then opening the As cell shutter. We expected that the above procedure would favor the formation of Ga droplets, which are essential for GaAs NW growth via a VLS mechanism[24]. The growth temperature of GaAs NWs was about 620 oC and the Ga and As4 fluxes were 4.1 × 10⁷ mbar and 3.1 × 10⁶ mbar (if no specific description), respectively. At the end of the GaAs NW growth, to control NW morphology and structure, the Ga and As cell shutters were closed with different sequences before the substrate temperature was lowered to 200 oC within a few minutes. Detailed Ga and As cell shutters closing sequences will be given later.

The morphology and crystal structure of the GaAs NWs were characterized by scanning electron microscopy (SEM, Hitachi S-4800) and transmission electron microscopy (TEM, JEOL2100 operated at 200 kV). The chemical compositions of the GaAs NWs were investigated by X-ray energy-dispersive spectroscopy (EDX). For TEM analysis, GaAs NWs were removed from the growth substrate via sonication in ethanol and then drop-cast onto lacey carbon grids.

To investigate the effect of the cell shutter closing sequence on the morphology and structure of GaAs NWs, we began our work by growing GaAs NWs on Si (111) substrates and the NW growth was terminated by closing the Ga and As cell shutters simultaneously. Figs. 1(a) and 1(b) show 25o tilted view and side-view SEM images of GaAs NWs grown on Si (111) substrates, respectively. As can be seen, GaAs NWs have been grown on the Si substrate surface, and all of them grew along the [111] direction Ga droplets exist on the top of GaAs NWs, which is consistent with growth of these GaAs NWs via a self-catalyzed VLS mechanism[24]. The growth time of NWs is 50 min, and the diameter and length of the NWs are around 95 nm and 5 μm, respectively. GaAs NWs have a pure ZB structure except for the section near the top. Fig. 1(c) shows a typical TEM image recorded from the middle part of the GaAs NW, and its corresponding high resolution TEM (HRTEM) image (Fig. 1(d)) and the fast Fourier transform image (inset of Fig. 1(c)) confirm that GaAs NW presents a ZB crystal structure. Fig. 1(e) shows a typical TEM image taken from the top section of the GaAs NW, and the corresponding HRTEM image is shown in Fig. 1(f). The observed structural phase transition from ZB to WZ in this section can be explained by the TPL shift mode[24], according to which, when Ga and As cell shutters are turned off, Ga droplets begin to be consumed and the TPL retreats along the sidewall of the NW, generating a transition layer consisting of DS, until it reaches the top of the NW, where the TPL nucleation makes WZ phase formation [24, 32-34].

Figure  1.  (a) and (b) The 25 tilted view and side-view SEM images of GaAs NWs grown on Si (111) substrates, respectively. (c) A typical TEM image recorded from the middle part of the GaAs NW. The inset is its fast Fourier transform image. (d) A HRTEM image taken from the side section (marked with a blue rectangle in Fig. 1(c)) of the NW. (e) A typical TEM image taken from the top section of the GaAs NW. (f) A HRTEM image taken from the top section (marked with a red rectangle in Fig. 1(e)) of the NW

Next, we grew GaAs NWs on Si (111) substrates and the growth was stopped by closing the Ga cell shutter 1 minute before closing the As cell shutter. This cell shutter close sequence is expected to consume the Ga droplet completely. Fig. 2(a) shows a 25o tilted view SEM image of the GaAs NWs grown on Si (111) substrates. Fig. 2(b) depicts a typical TEM image of the GaAs NW, and its HRTEM images taken from the top part and middle parts of the NW are shown in Figs. 2(c)-2(e), respectively. The body part of the GaAs NW presents a pure ZB structure (Fig. 2(e)). It is found obviously that at the top of the NW, the Ga droplet is indeed consumed completely, and structural transition appears from ZB to WZ, then to ZB; defects are also formed between the ZB and WZ (Figs. 2(c) and 2(d)). These results are expected according to the TPL shift mode[24].

Figure  2.  (a) SEM image of GaAs NWs with Ga droplet being consumed completely. (b) TEM morphology image of the GaAs NW. (c), (d), and (e) Corresponding HRTEM images taken from the top and middle parts of the GaAs NW, respectively

GaAs NWs were also grown on Si (111) substrates with different Ga flux existing times after closing the As cell shutter. That is to say, at the end of the GaAs NW growth, we closed the As cell shutter first and then closed the Ga shutter after several seconds. Figs. 3(a)-3(c) show the 25o tilted view SEM images of GaAs NWs with the Ga flux existing time of 0, 20 and 60 s, respectively. As shown in the inset of Fig. 3(a), when the Ga flux existing time is 0 s, the GaAs NW has a homogeneous diameter and a Ga droplet locates at the top of the NW, as we mentioned in Fig. 1. When the Ga flux existing time was extended to 20 s, the top parts of the GaAs NWs began to kink and the diameter becomes larger than the body part of NWs, as shown in Fig. 3(b). Further extending the Ga flux existing time to 60 s, the top parts of the GaAs NWs grew non-vertically and the NW growth direction changes from [111] to non-[111] (Fig. 3(c)). The lengths of the kinked NWs increase obviously with extending the Ga flux existing time. To be mentioned, the GaAs NWs shown in Figs. 3(a)-3(c) were grown with a V/Ⅲ beam equivalent pressure (BEP) ratio of 7.6. We also grew GaAs NWs with a V/Ⅲ BEP ratio of 9 and Ga flux existing time for 20 s after closing the As cell shutter (Fig. 3(d)). As shown in the inset of Fig. 3(d), we find that the diameter in the tip is larger than that of the NW body part, while there is no change of the NW growth direction. Because the NWs in Figs. 3(d) and 3(b) were grown with the same Ga flux and substrate temperature, we conjected that the relatively high V/Ⅲ BEP ratio used is a possible reason for the vertical growth at the top part of the GaAs NW. The Ga droplet on the top of the GaAs NW was almost exhausted owing to the As-rich atmosphere in the MBE chamber (inset of Fig. 3(d)).

Figure  3.  (a)-(c) SEM images of GaAs NWs grown with a V/Ⅲ BEP ratio of 7.6 and Ga flux existing time for 0, 20, and 60 s after closing As cell shutter, respectively. (d) SEM image of GaAs NWs grown with a V/Ⅲ BEP ratio of 9 and Ga flux existing time for 20 s after closing As cell shutter. Insets show the corresponding magnified SEM images of a single NW at the top section

In order to understand the growth process of the top sections of GaAs NWs grown with different Ga flux existing times after closing the As cell shutter, the morphology evolution diagrams of GaAs NWs are shown in Figs. 4(a)-4(d). Fig. 4(a) shows an evolution process of GaAs NWs with the Ga and As cell shutters closed at the same time. As GaAs NWs are still in an As-rich atmosphere after closing the Ga and As cell shutters, Ga droplets are consumed a bit, which makes the TPL pass through the edges between the top and side facets of the NWs, and DS and WZ crystal structure appear as discussed in Fig. 1(f). As shown in Fig. 4(b), if we close the As cell shutter first and keep the Ga cell shutter open for 20 s, the Ga droplet will become too large to be stable and slide down to the sidewalls of vertical GaAs NWs gradually, and nucleation happens along one of the non-vertical directions. Further extending Ga flux existing time to 60 s, the length of the non-vertical GaAs NW on the new direction becomes longer (Fig. 4(c)). The V/Ⅲ BEP ratio of GaAs NWs was changed to 9 with the same procedure as Fig. 4(b), the Ga droplet also became too large to be stable and slide down to the NW sidewalls gradually as shown in Fig. 4(d). However, a stable Ga droplet on the top of the GaAs NW will form soon and then crystallize quickly due to the high V/Ⅲ BEP ratio, which keeps a vertical tip for the NWs. After closing the Ga cell shutter, the Ga droplet would be exhausted gradually under the As-rich atmosphere, as shown in Figs. 3(d) and 4(d).

Figure  4.  (a)-(c) Magnified SEM images and corresponding morphology evolution diagrams of GaAs NWs grown with a V/Ⅲ BEP ratio of 7.6 and Ga flux existing time for 0, 20, and 60 s after closing As cell shutter, respectively. (d) A magnified SEM image and corresponding morphology evolution diagrams of GaAs NW grown with a V/Ⅲ BEP ratio of 9 and Ga flux existing time for 20 s after closing As cell shutter

As discussed above, GaAs NWs' growth direction and morphology can be tuned by varying the Ga flux existing time after closing the As cell shutter. To investigate the structure information of these NWs and confirm the growth direction of kinked GaAs NWs, TEM observations were carried out. Fig. 5 shows the TEM images for GaAs NWs grown with a V/Ⅲ BEP ratio of 7.6 and Ga flux existing time for 60 s after closing the As cell shutter (corresponding SEM image is shown in Fig. 3(c)). The rectangles in Fig. 5(a) highlight the regions where the HRTEM images were recorded. Figs. 5(b)-5(g) show the HRTEM images taken from the regions A, B, C, D, E and F in Fig. 5(a), respectively. As shown in Fig. 5(b), the body part of GaAs NW is grown along the [111] direction (vertical to Si (111) substrate). Figs. 5(c) and 5(e) are the HRTEM images of the corner part (B and D sections) of the GaAs NW, and we can see that the growth direction of the GaAs NW changes from [111] to non-[111]. The angle between the [111] and non-[111] directions is 70.5o. Considering that the preferential growth direction of GaAs NWs is 111 and the NWs have {110} side facets, we confirm that the direction of the kinked GaAs NWs is 11ˉ1. We observe that twins appear on the sidewalls during growth direction changing as shown in Figs. 5(f) and 5(g), but it does not seem intrinsically relevant to this phenomenon. Also, no structural transition happens at the top of the GaAs NW due to the large enough Ga droplet during Ga supply for 60 s, wetting the sidewalls of NW and thus causing no appearance of the WZ phase. We obtain a rather clean section (Fig 5(c)) without any defect formation.

Figure  5.  TEM images for GaAs NWs grown with a V/Ⅲ BEP ratio of 7.6 and Ga flux existing time for 60 s after closing As cell shutter. (a) Low-resolution TEM image of a GaAs NW. The rectangles highlight the regions where the HRTEM images were recorded; (b)-(g) HRTEM images taken from the regions A, B, C, D, E, and F in (a), respectively

Figs. 6(a)-6(c) show the TEM images of a typical GaAs NW grown with the V/Ⅲ BEP ratio of 9 and Ga flux existing time for 20 s after closing the As cell shutter (its SEM images are shown in Fig. 3(d) and Fig. 4(d)). As can be seen from Fig. 6(a), the diameter changes obviously at the top part of NW, which is consistent with the SEM results above. The Ga droplet has been consumed completely due to the high V/Ⅲ BEP ratio and As-rich atmosphere. Fig. 6(c) depicts a HRTEM image corresponding to the section of NW marked with the red rectangle as shown in Fig. 6(b). It is found that almost the whole GaAs NW presents a ZB structure except the top part, where there is a structural phase transition from ZB to WZ and finally to ZB again. The structural phase transition near the end of NW can be explained by the TPL shift mode[24]. For a better understanding of the TPL shift mode in this case, illustrations of the effect of the Ga droplet size on the crystal structure of the GaAs NW are shown in Fig. 6(d). The nucleation mechanism is based on the shift of the TPL position and nucleation sites along the NW during the whole growth process. The shift of the TPL position is related to the evolution of the shape and volume of the Ga droplet at the end of NW growth[24]. It is well known that when the droplet only wets the top facets of the NWs, TPL nucleation favors the WZ phase growth in the standard VLS mechanism[24, 35], and a pure ZB structure is favored when the side-walls of the NWs are wetted by Ga droplets due to the low liquid-vapor surface energy of Ga droplets[19, 24, 36, 37]. In our case, GaAs NWs present the ZB structure due to the TPL being on the side-wall instead of on the top of the NW (Fig. 6(d)). When the As cell shutter is closed and Ga flux still exists, the volume of Ga droplet will become larger gradually, which makes the Ga droplet unstable. TPL nucleation is not suitable at this moment and thus the ZB structure forms (Fig. 6(e)). The Ga droplet will become stable again for the large diameter of the NW (Fig. 6(f)). After 20 s, the Ga flux is also stopped, and the Ga droplet begins to be consumed under the As-rich atmosphere. The TPL retreats along the side-wall of the NW, generating a transition layer consisting of defects, until it reaches the top of the NW (Fig. 6(g)). When the TPL shifts to the top facet and the Ga droplet wets only the top facet, the WZ structure is formed due to the TPL nucleation (Fig. 6(h)). When the droplet becomes small to some degree it will move along the NWs' top facet leading to a ZB phase again which is because the unconstrained nucleation on the flat surface as well as the possible breakdown of the condition for TPL nucleation (Fig. 6(i))[24, 33 35]. Thus the structural transition at the top part of the NW can be explained by the TPL shift mode.

Figure  6.  (a), (c) TEM images of the top section of a GaAs NW grown with a V/Ⅲ BEP ratio of 9 and Ga flux existing time for 20 s after closing As cell shutter. (d)-(i) Illustrations of the effect of the Ga droplet on the crystal structure of the GaAs NW. The yellow dots and black arrows indicate the positions and moving directions of the TPL, respectively. Blue and green indicate ZB and WZ phases, respectively

In conclusion, self-catalyzed GaAs NWs are grown on Si (111) substrates by MBE. At the end of GaAs NW growth, the effect of different closing sequences of the Ga and As cell shutters on the morphology and structural phase of the GaAs NWs is investigated. After closing the As cell shutter, several Ga flux existing times have been tried and it is shown to be critical for GaAs NWs growth by changing the growth direction from [111] to 11ˉ1. While for the sequences of closing Ga and As cell shutters simultaneously or closing the Ga cell shutter first and then closing the As cell shutter 1 min later, the GaAs NWs remain vertical. The morphology evolution of GaAs NWs and the structural phase transition at the end part of these GaAs NWs confirm that the TPL shift mode is applicable even for the growth terminated with different Ga flux existing times.


[1]
Bigas M, Cabruja E, Forest J, et al. Review of CMOS image sensor. Microelectron J, 2006, 37(5), 433 doi: 10.1016/j.mejo.2005.07.002
[2]
Luo B, Yang F X, Yan L. Key technologies and research development of CMOS image sensors. IITA International Conference on Geoscience and Remote Sensing, 2010, 322
[3]
Fontaine R. Innovative technology elements for large and small pixel CIS devices. Proc International Image Sensor Workshop (IISW), 2013, 1
[4]
Wang X D, Ye T. Comparative research and future tendency between CMOS and CCD image sensor. Electron Des Eng, 2010, 18(11), 184
[5]
Jan B, Erik J M, Wilco K, et al. Recent developments on large-area CCDs for professional applications. International image sensor workshop. Proc International Image Sensor Workshop (IISW), 2015, 1
[6]
Velichko S, Hynecek J, Johnson R, et al. CMOS global shutter charge storage pixels with improved performance. IEEE Trans Electron Devices, 2015, 63(1), 1 doi: 10.1109/TED.2015.2443495
[7]
Solhusvik J, Kuang J, Lin Z, et al. A comparison of high dynamic range CIS technologies for automotive applications. Proc International Image Sensor Workshop, 2013, 1
[8]
Freedman S D, Boussaid F. A high dynamic range CMOS image sensor with a novel pixel-level logarithmic counter memory. IEEE International Conference on Knowledge-Based Engineering and Innovation (KBEI), 2015, 14
[9]
Takayanagi I, Yoshimura N, Mori K, et al. An 87 dB single exposure dynamic range CMOS image sensor with a 3.0 μm triple conversion gain pixel. Proc International Image Sensor Workshop (IISW), 2017, 30
[10]
Wang R G, Yin Y X, Liang L, et al. A high dynamic range CMOS image sensor with dual charge transfer phase. IEEE International Conference on Solid-State and Integrated Circuit Technology (ICSICT), 2016, 1369
[11]
Yu J T, Li B Q, Yu P P, et al. Two-dimensional pixel image lag simulation and optimization in a 4-T CMOS image sensor. J Semicond, 2010, 31(9), 094011 doi: 10.1088/1674-4926/31/9/094011
[12]
Lofthouse-Smith D D, Soman M R, Allanwood E A H, et al. Image lag optimisation in a 4T CMOS image sensor for the JANUS camera on ESA's JUICE mission to Jupiter. Int Soc Opt Photonics, 2018, 10709, 107091J doi: 10.1117/12.2313686
[13]
Rizzolo S, Goiffon V, Estribeau M, et al. Influence of pixel design on charge transfer performances in CMOS image sensors. IEEE Trans Electron Devices, 2018, 65(3), 1048 doi: 10.1109/TED.2018.2790443
[14]
Orly Y P, Ran G, Yosi S D. A random access photodiode array for intelligent image capture. IEEE Trans Electron Devices, 1991, 38(8), 1772 doi: 10.1109/16.119013
[15]
Iltgen K, Bendel C, Benninghoven A. Optimized time-of-flight secondary ion mass spectroscopy depth profiling with a dual beam technique. J Vac Sci Technol A, 1997, 15(3), 460 doi: 10.1116/1.580874
[16]
Park Y H. Image sensor having self-aligned and overlapped photodiode and method of making same. US Patent 7180151, 2007
[17]
Li Z H. Research on image sensor with ultra wide dynamic range. PhD Thesis, Jilin University, 2016
[18]
Cao X, Gäbler D, Lee C, et al. Design and optimisation of large 4T pixel. Proc Int Image Sensor Workshop (IISW), 2015, 112
[19]
Han L Q. Study on the charge transfer mechanism and noise of CMOS active pixel. PhD Thesis, Tianjin University, 2016
[20]
Oike Y, Akiyama K, Hung L D, et al. An 8.3M-pixel 480 fps global-shutter CMOS image sensor with gain-adaptive column ADCs and 2-on-1 stacked device structure. IEEE Symposium on VLSI Circuits, 2016, 1
[21]
Lim W, Hwang J, Kim D, et al. A low noise CMOS image sensor with a 14-bit two-step single-slope ADC and a column self-calibration technique. IEEE International Conference on Electronics, Circuits and Systems (ICECS), 2015, 51
[22]
Yeh S, Hsieh C. Novel single-slope ADC design for full well capacity expansion of CMOS image sensor. IEEE Sens J, 2013, 13(3), 1012 doi: 10.1109/JSEN.2012.2227706
[23]
Xu R, Ng W C, Yuan J, et al. A 1/2.5 inch VGA 400 fps CMOS image sensor with high sensitivity for machine vision. IEEE J Solid-State Circuits, 2014, 49(10), 2342 doi: 10.1109/JSSC.2014.2345018
Fig. 1.  N buried layer structure of PPD.

Fig. 2.  (Color online) 2D TCAD simulation of depletion region in traditional cubic PPD.

Fig. 3.  (Color online) The finger-shaped PPD and its top view.

Fig. 4.  (Color online) Under the basic ion implantation process conditions, the potential distribution in (a) initial phase, (b) after illumination phase, (c) transfer phase, (d) post-transition phase.

Fig. 5.  (Color online) Under the basic ion implantation process conditions: (a) the potential distribution in transfer phase, (b) the potential curve on the charge transfer path.

Fig. 6.  (Color online) Potential and depletion region distribution with different single-finger PPD widths.

Fig. 7.  (Color online) The number of electrons in PPD based on TCAD 2D simulation.

Fig. 8.  (Color online) Depletion zone and potential distribution with different PPD spacing.

Fig. 9.  (Color online) The number of electrons in PPD based on TCAD 2D simulation. (a) Using the process conditions of Fig. 2. (b) Using the process conditions of Fig. 8(d).

Fig. 10.  (Color online) The special finger-shaped PPD structure proposed in this paper: (a) three-dimensional structure, (b) sectional structural view, (c) 2D device simulation diagram.

Fig. 11.  (Color online) Pixel layout and the main layout level of PPD-TG-FD. (a) 2 × 2 pixel unit. (b) Layout of PPD-TG-FD.

Fig. 12.  Photoresponse with different single-finger spacing.

Fig. 13.  (Color online) FWC with different spacing (Before widening N1).

Fig. 14.  (Color online) The measurement results of test chip: (a) photoresponse of the pixel using the proposed PPD structure, (b) PTC of the pixel using the proposed PPD structure.

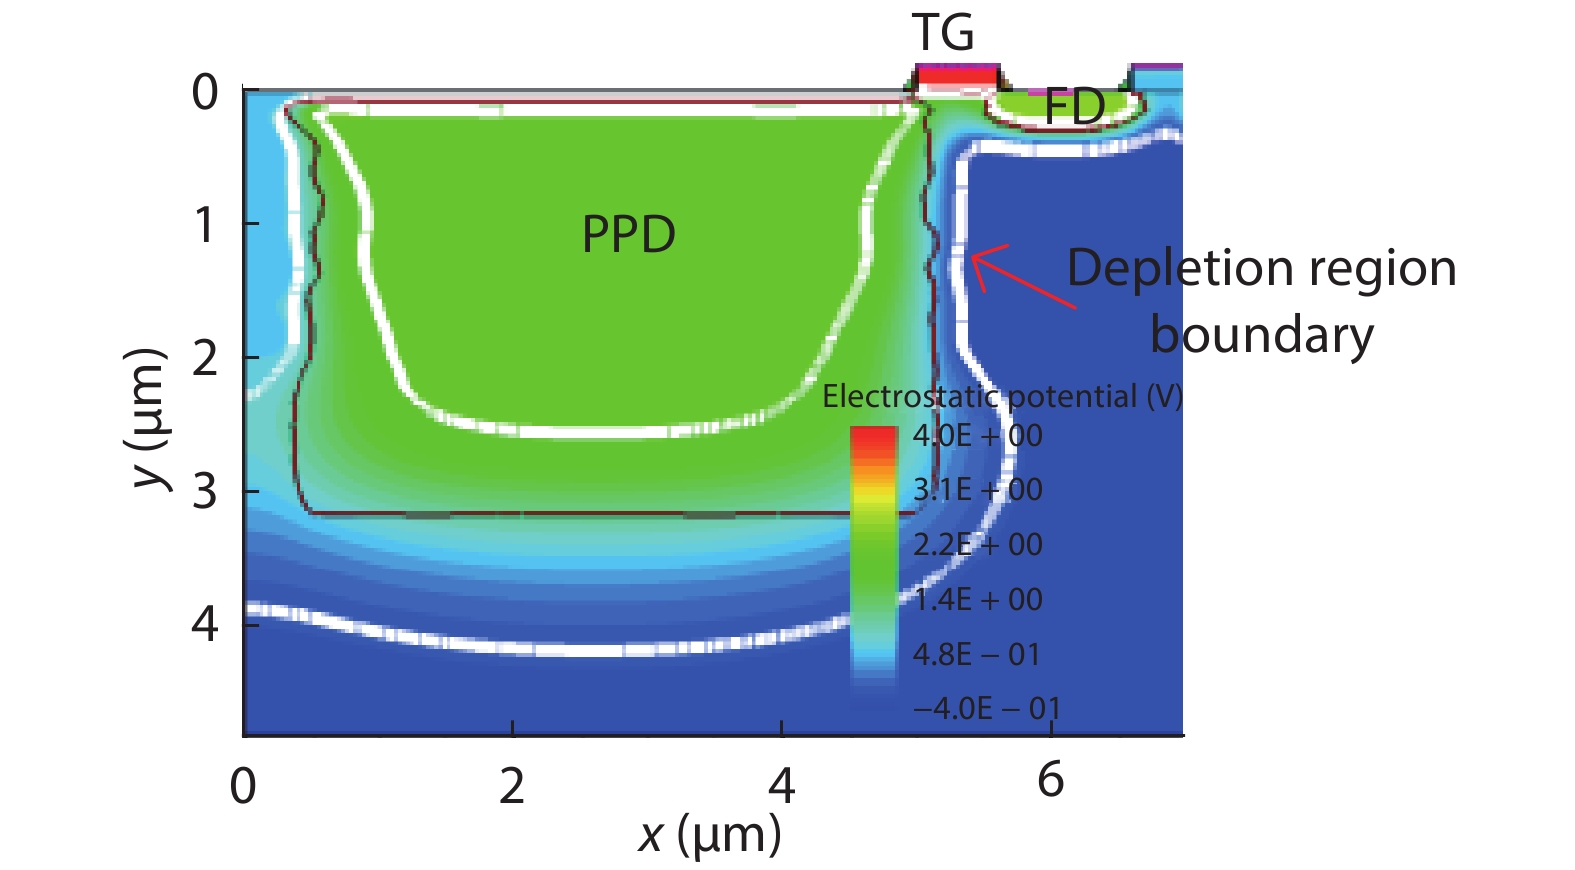
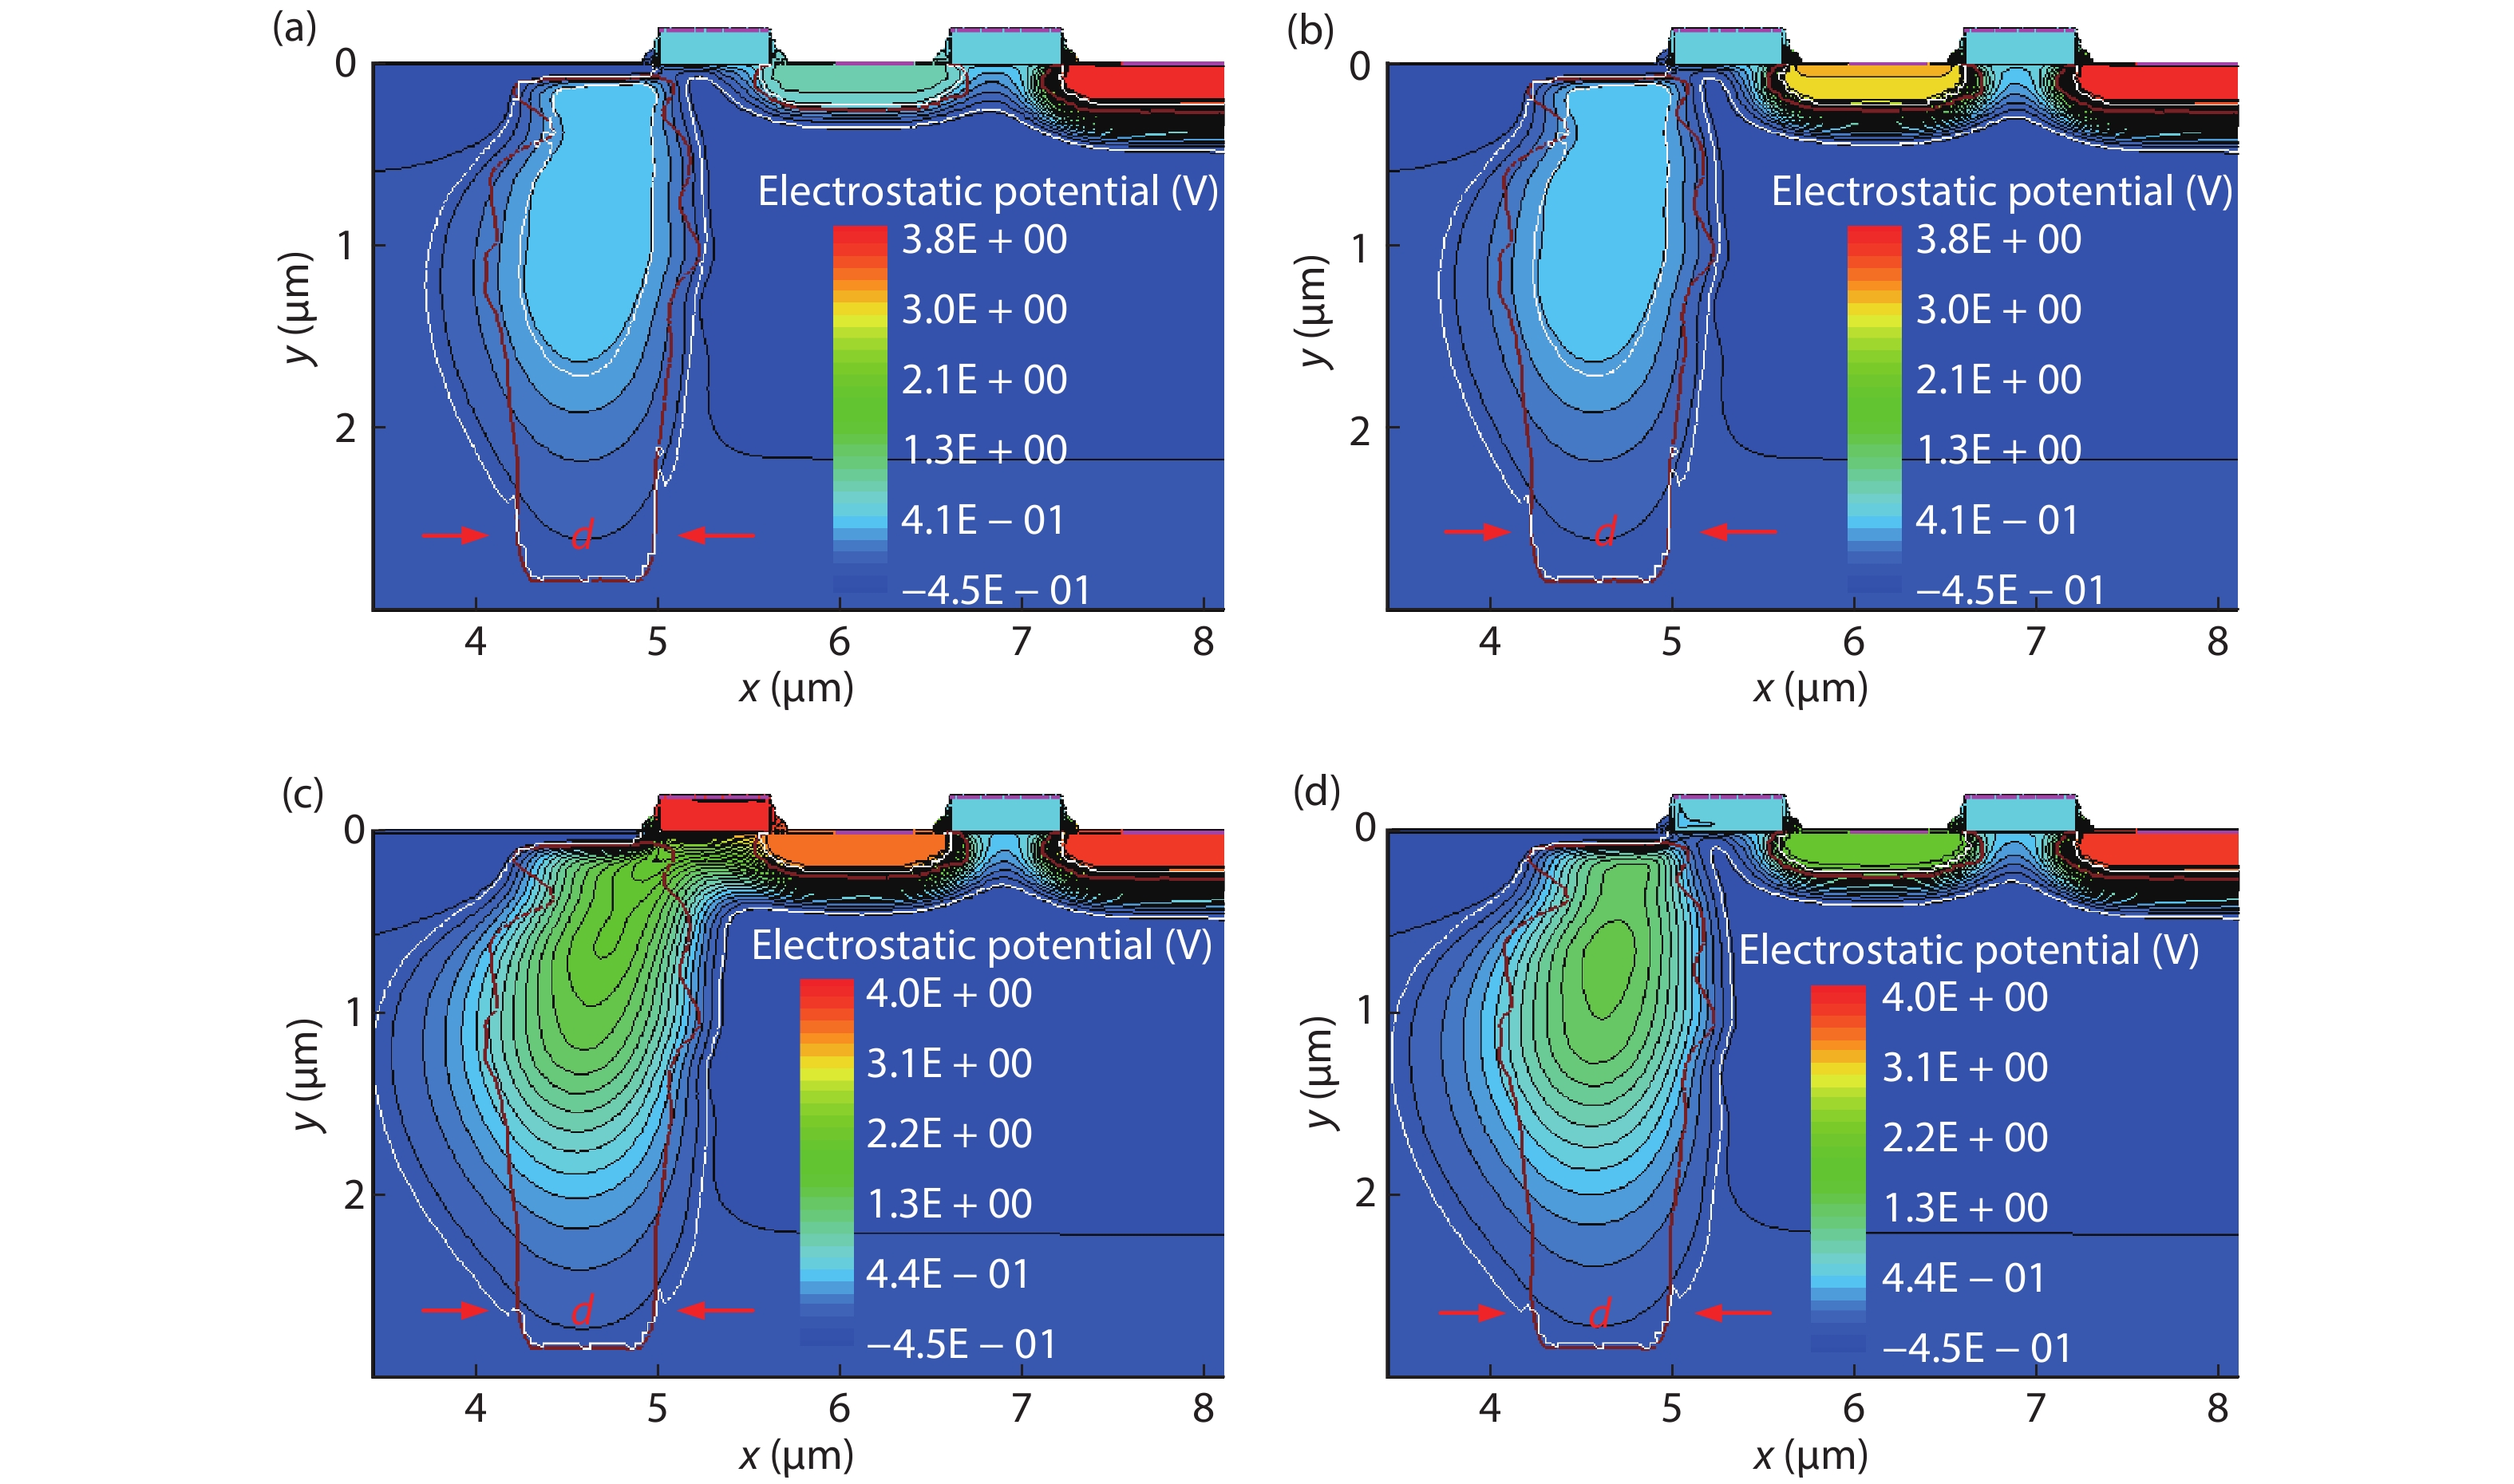
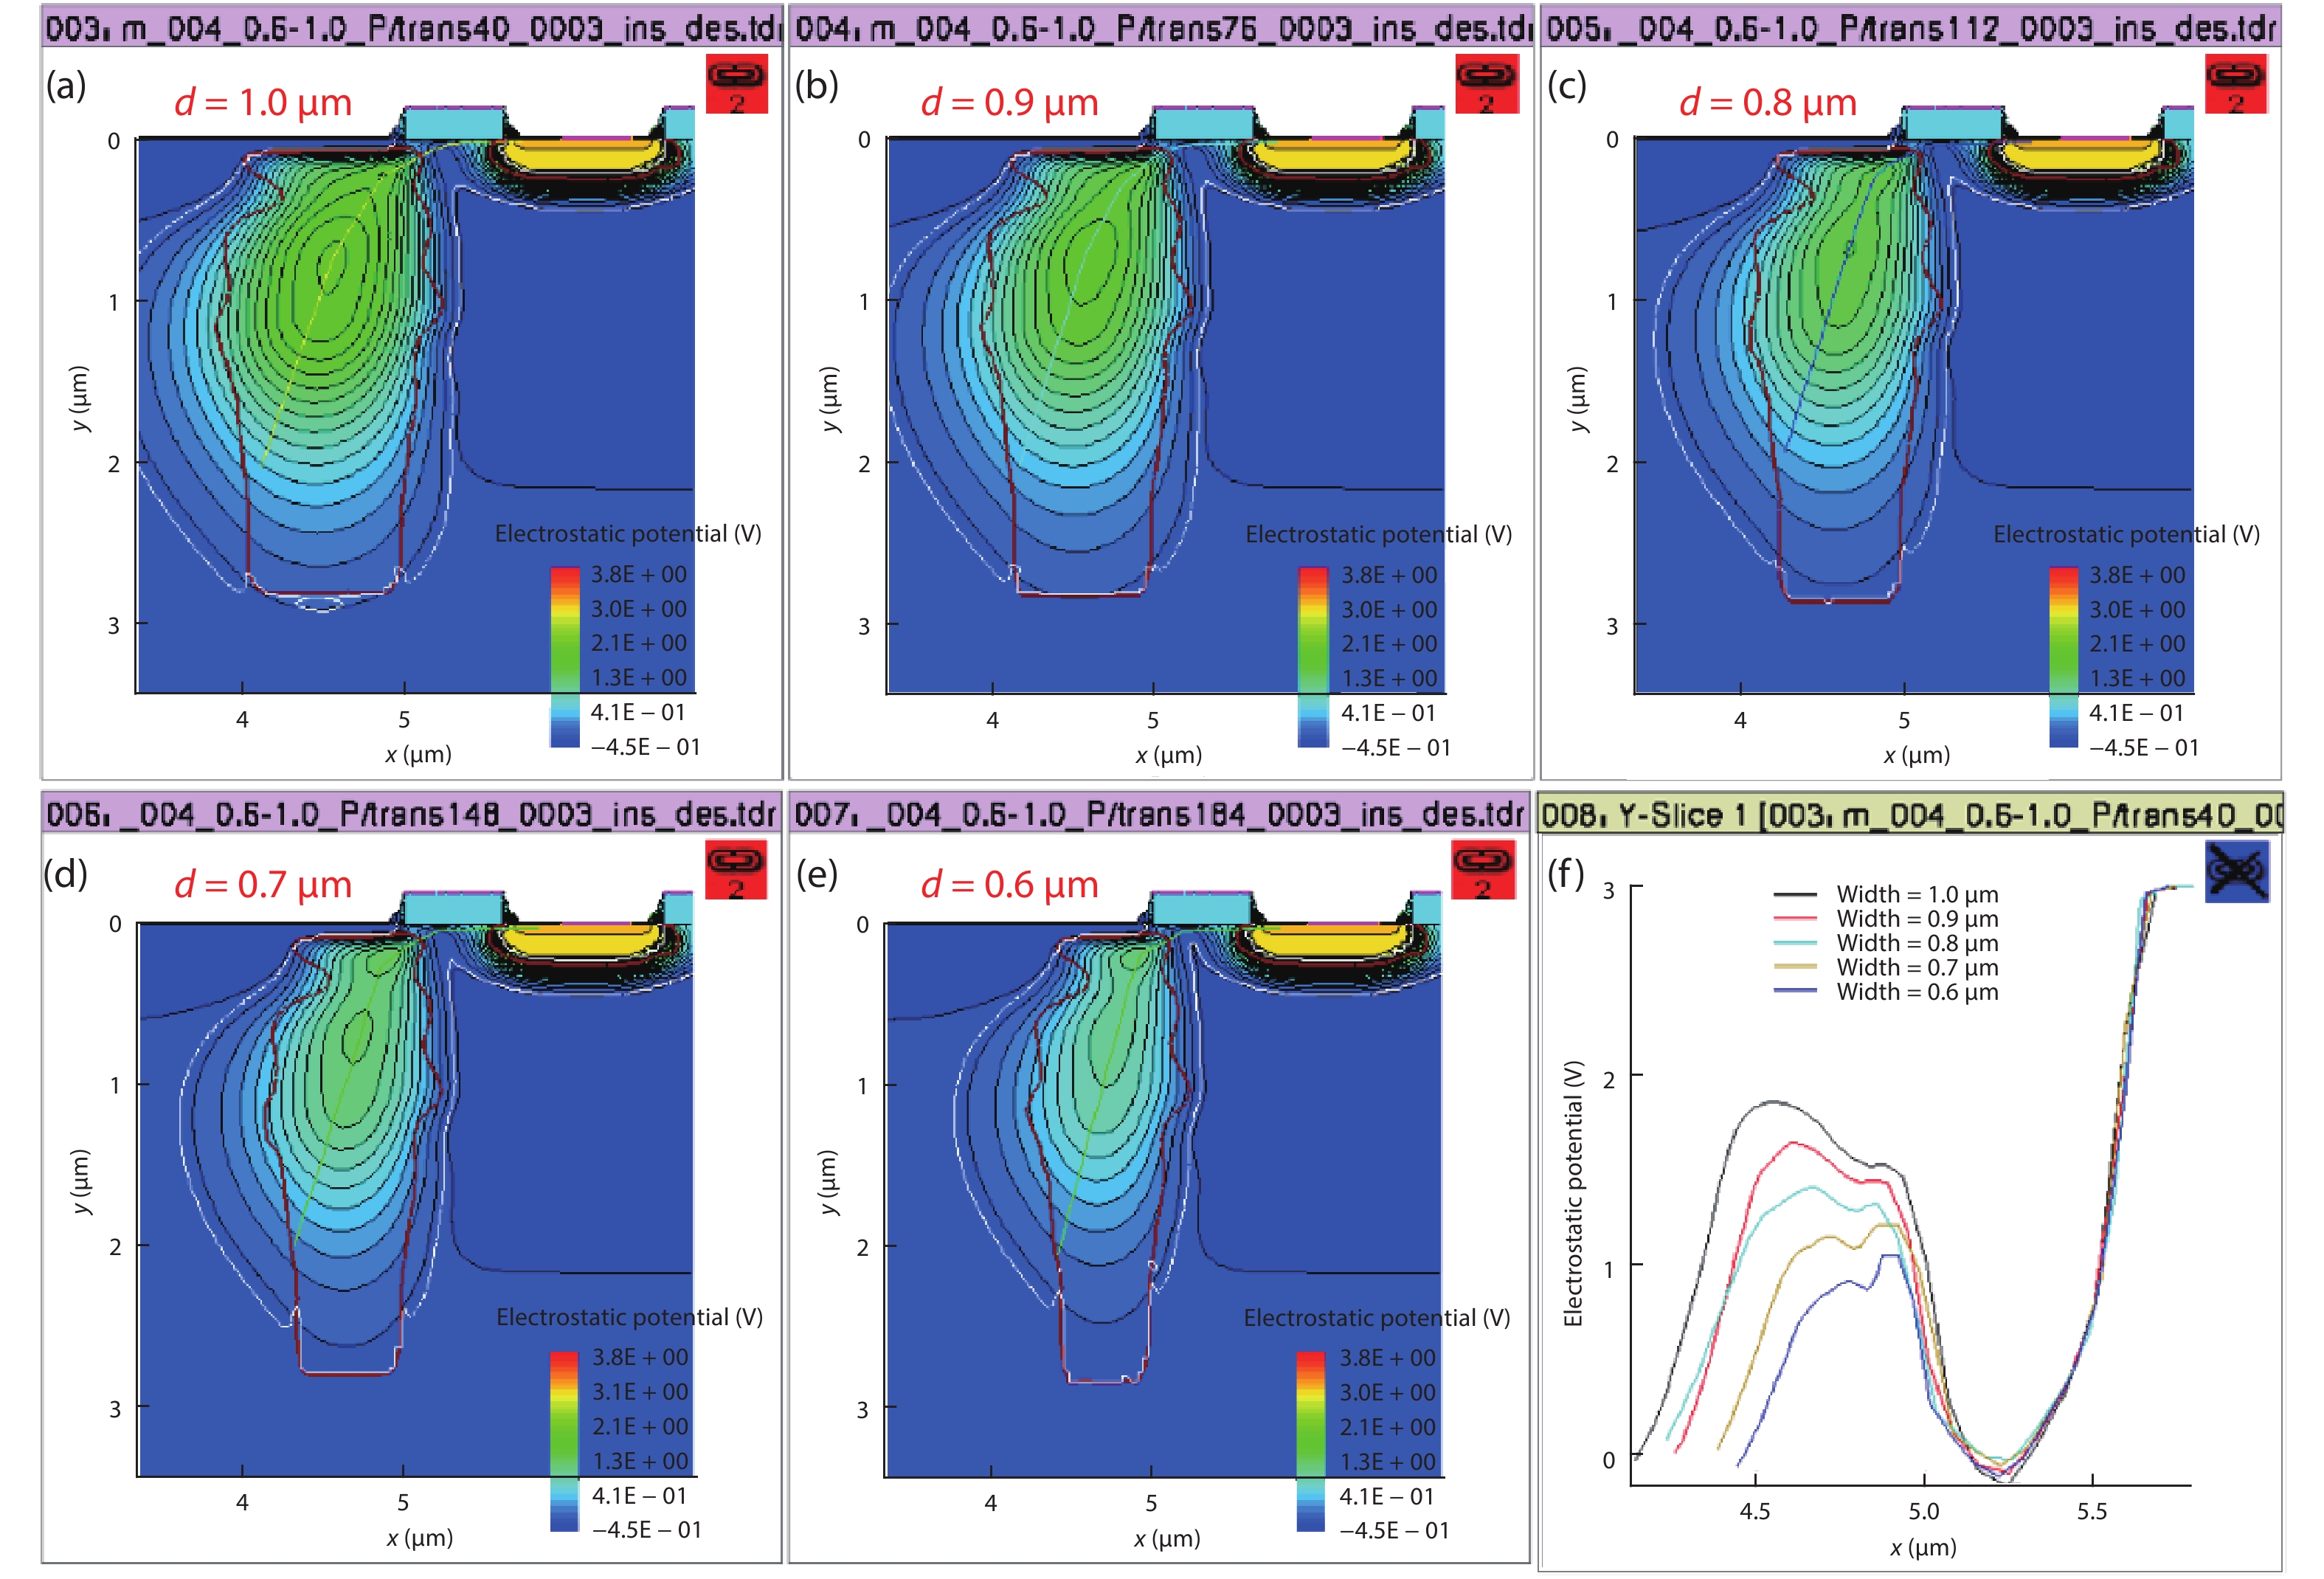
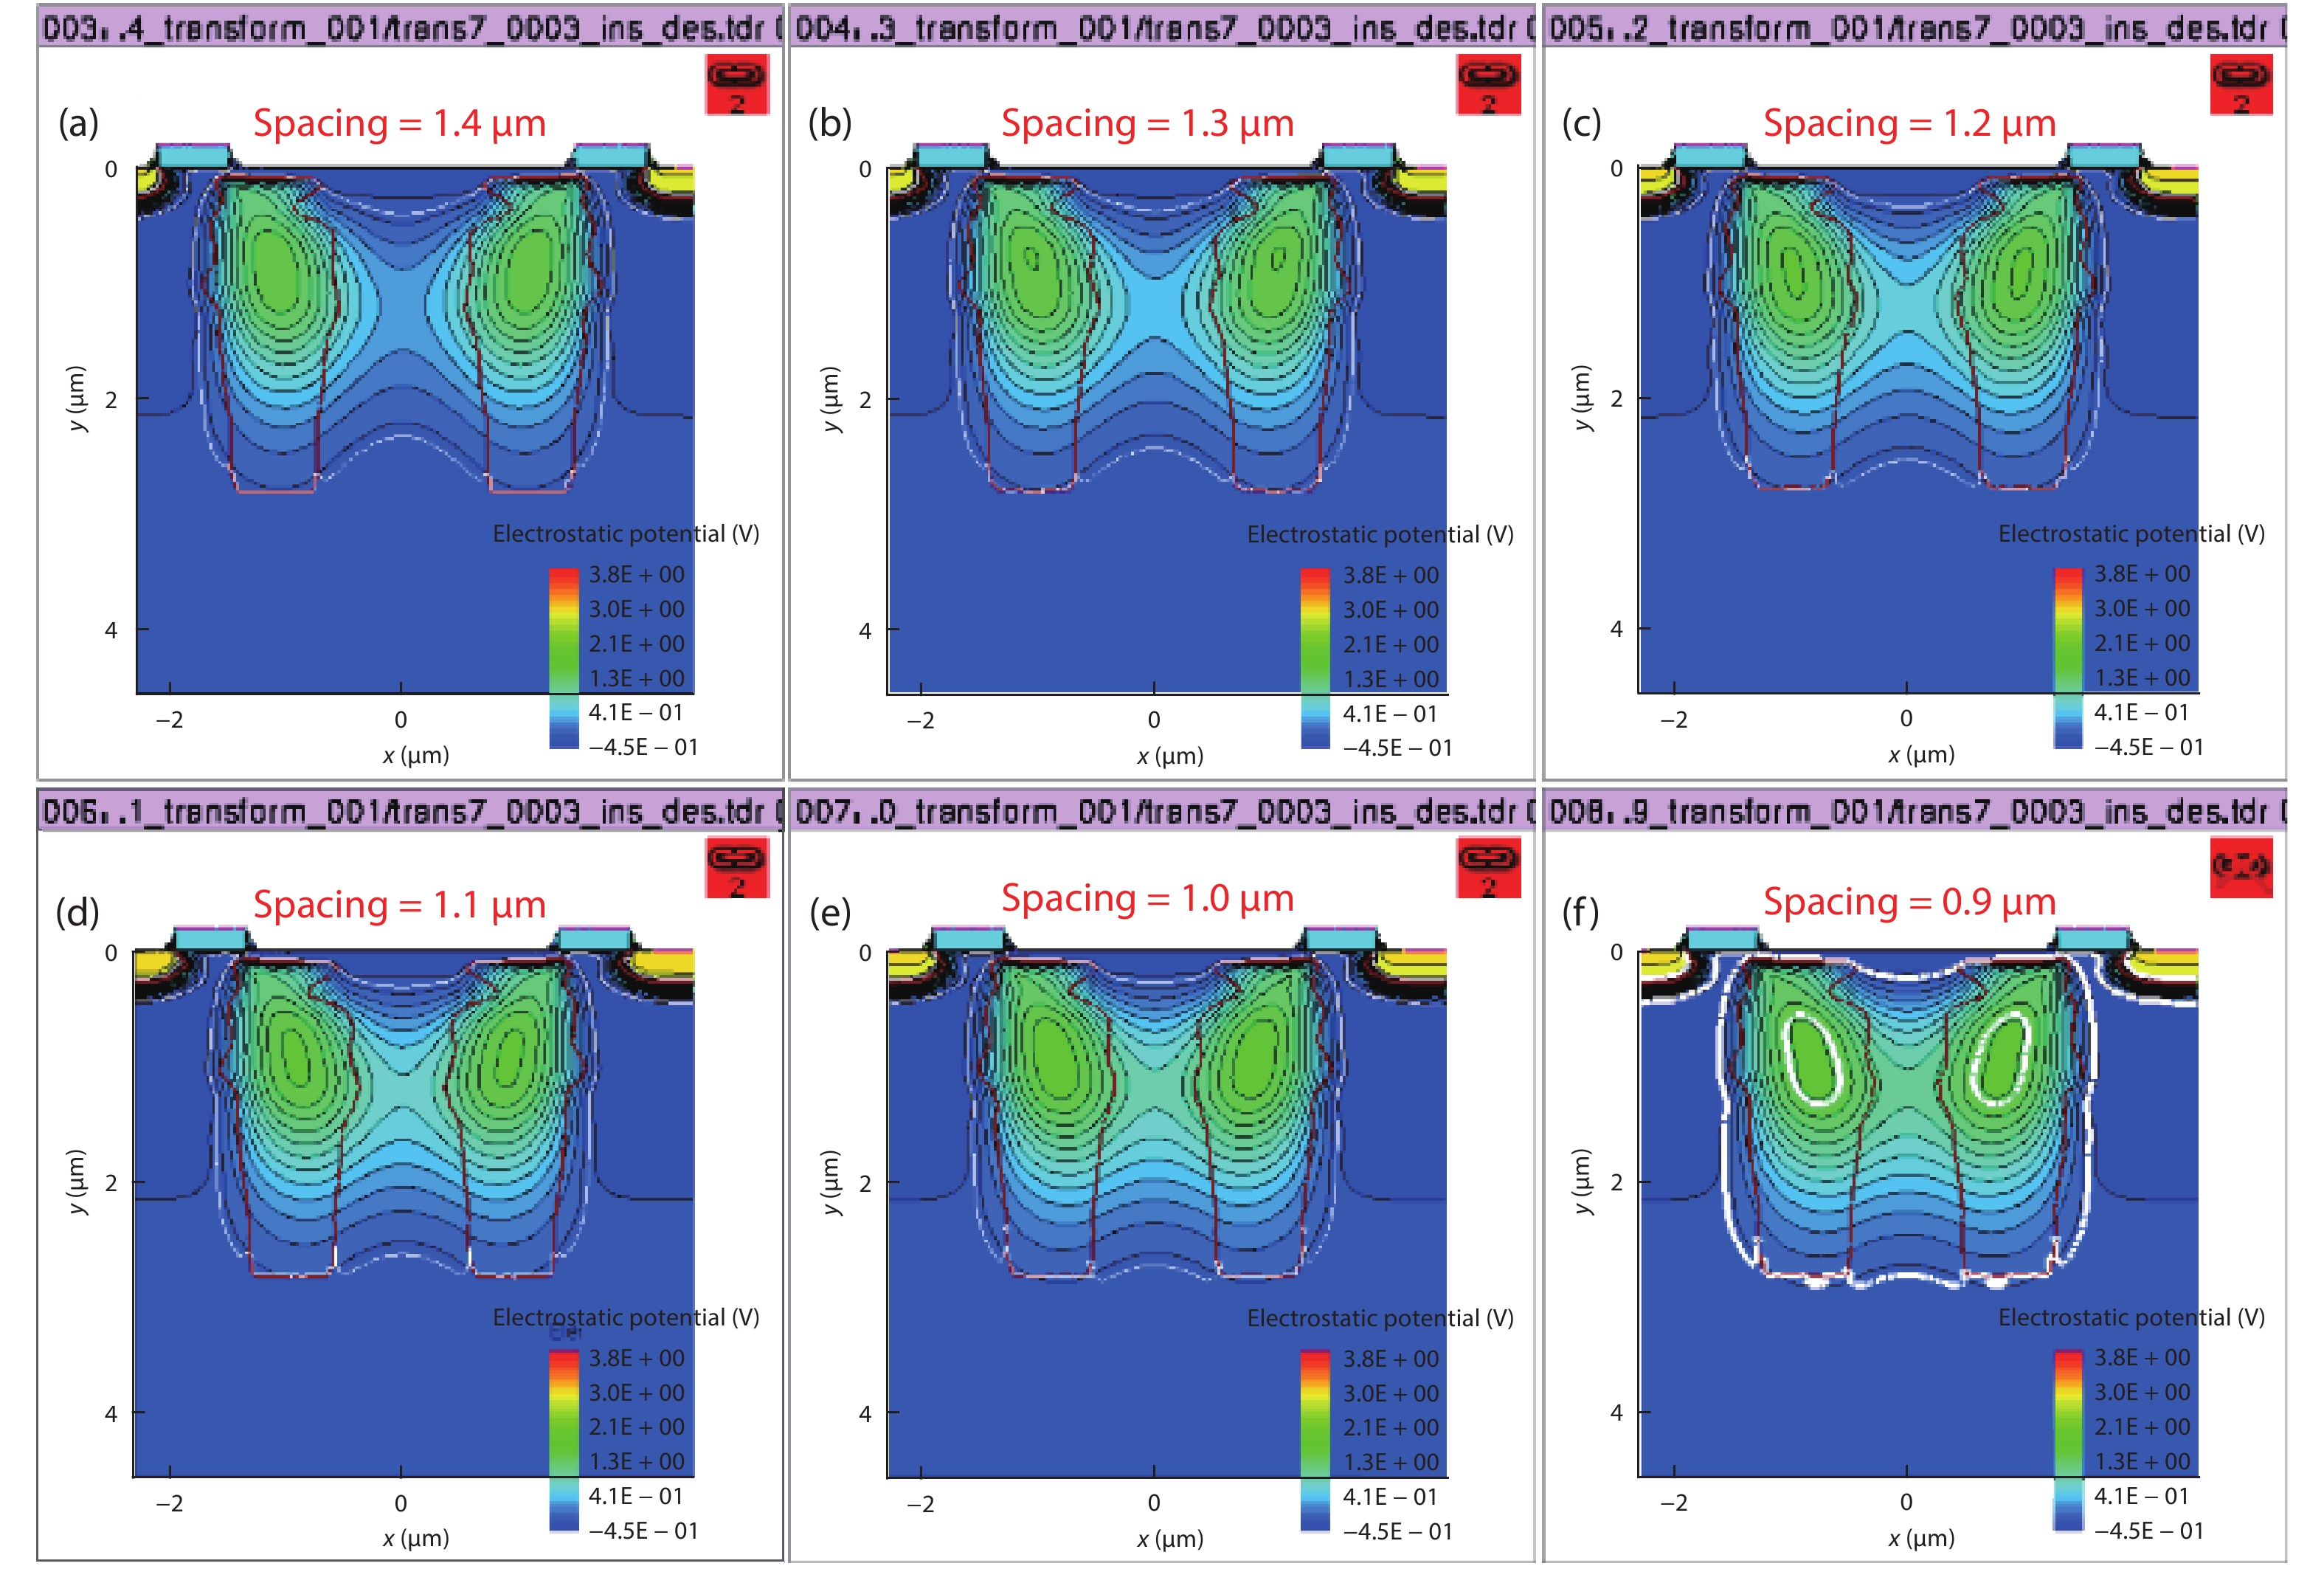
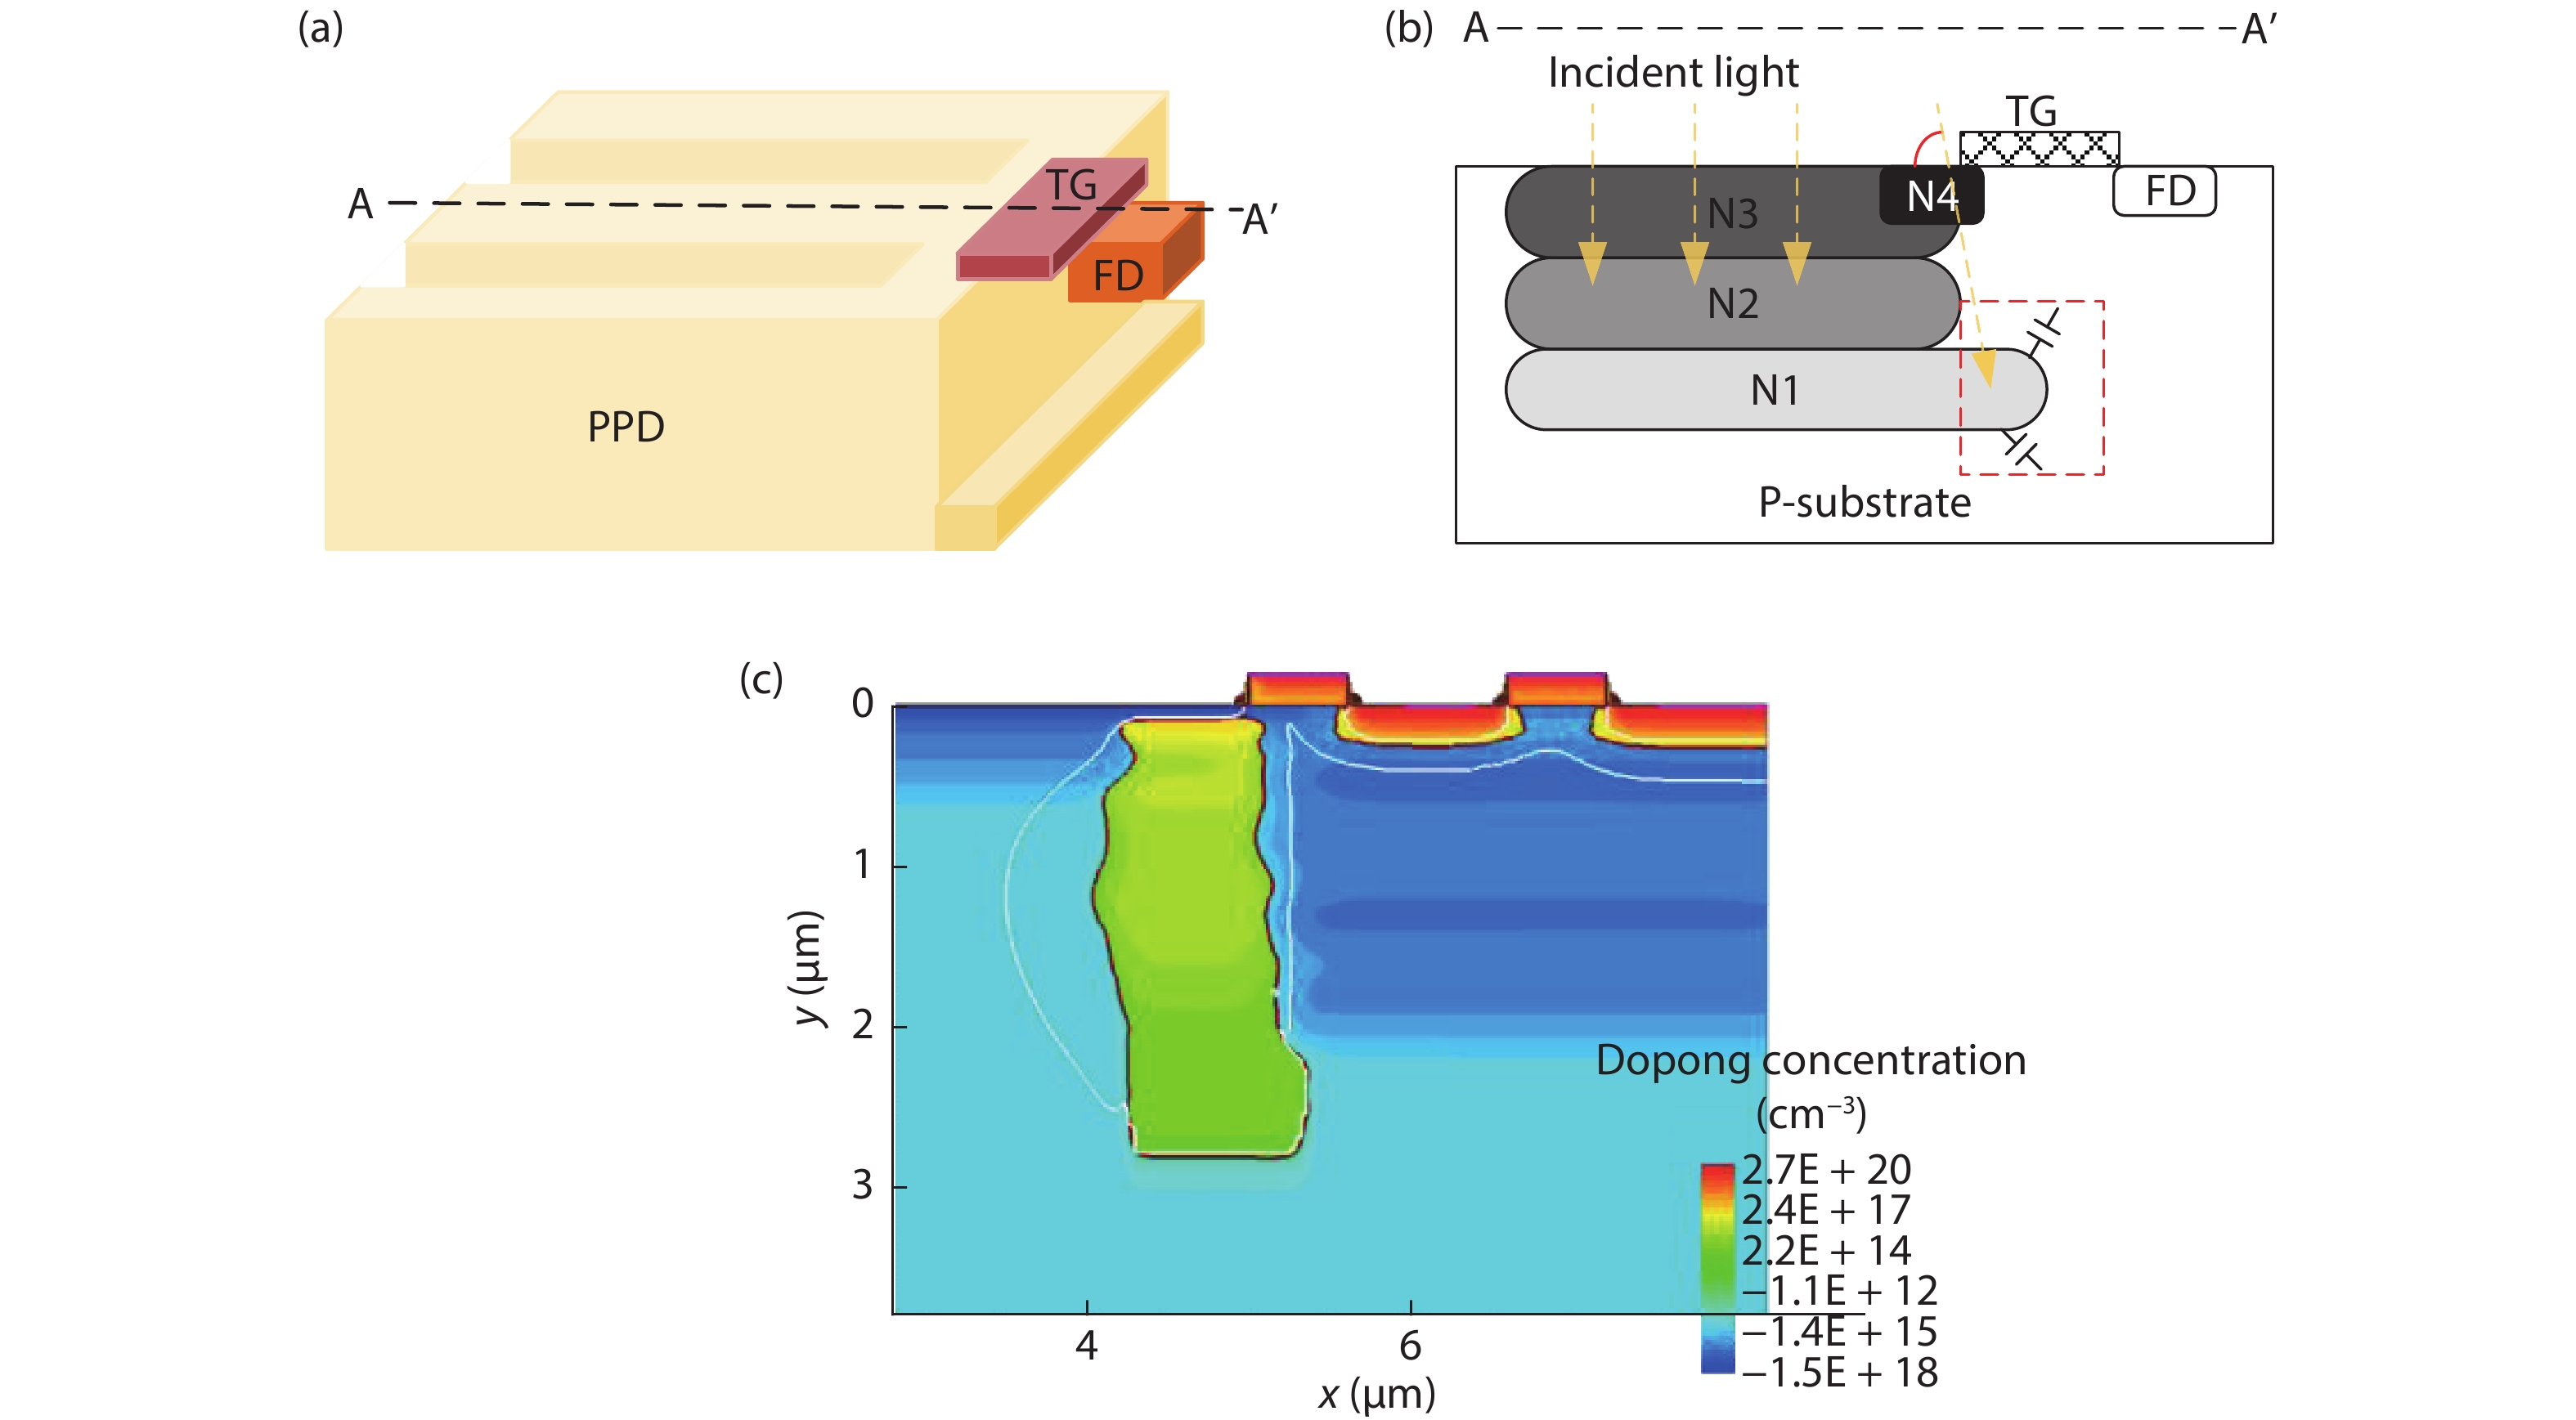
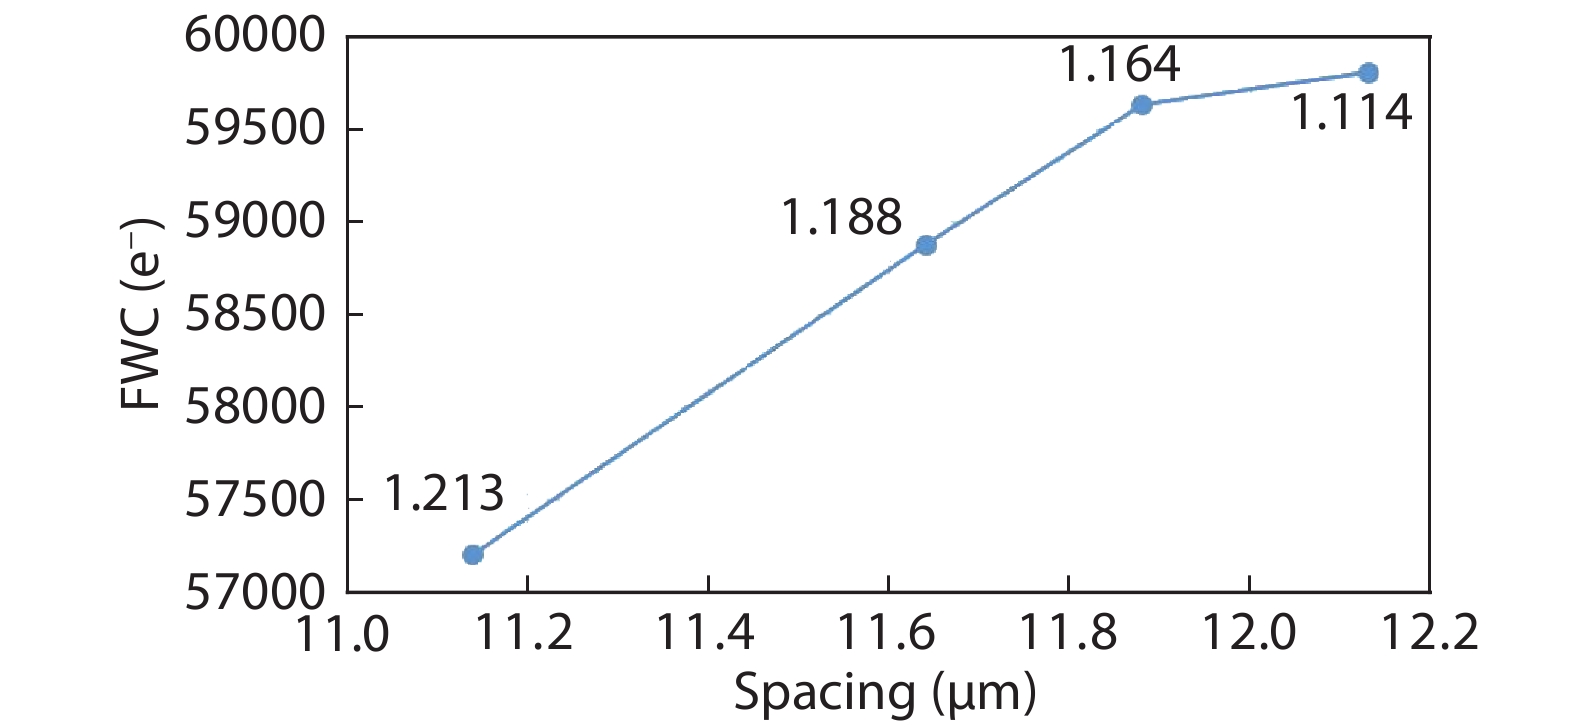
Table 1.   Vpin, NFWC and depletion depth (W) with different d.

d (μm)0.60.70.80.91.0
Vpin (V)1.0571.2151.4081.6461.863
NFWC (e)30944335551667257966
W (μm)2.8422.7922.8452.8452.845
DownLoad: CSV

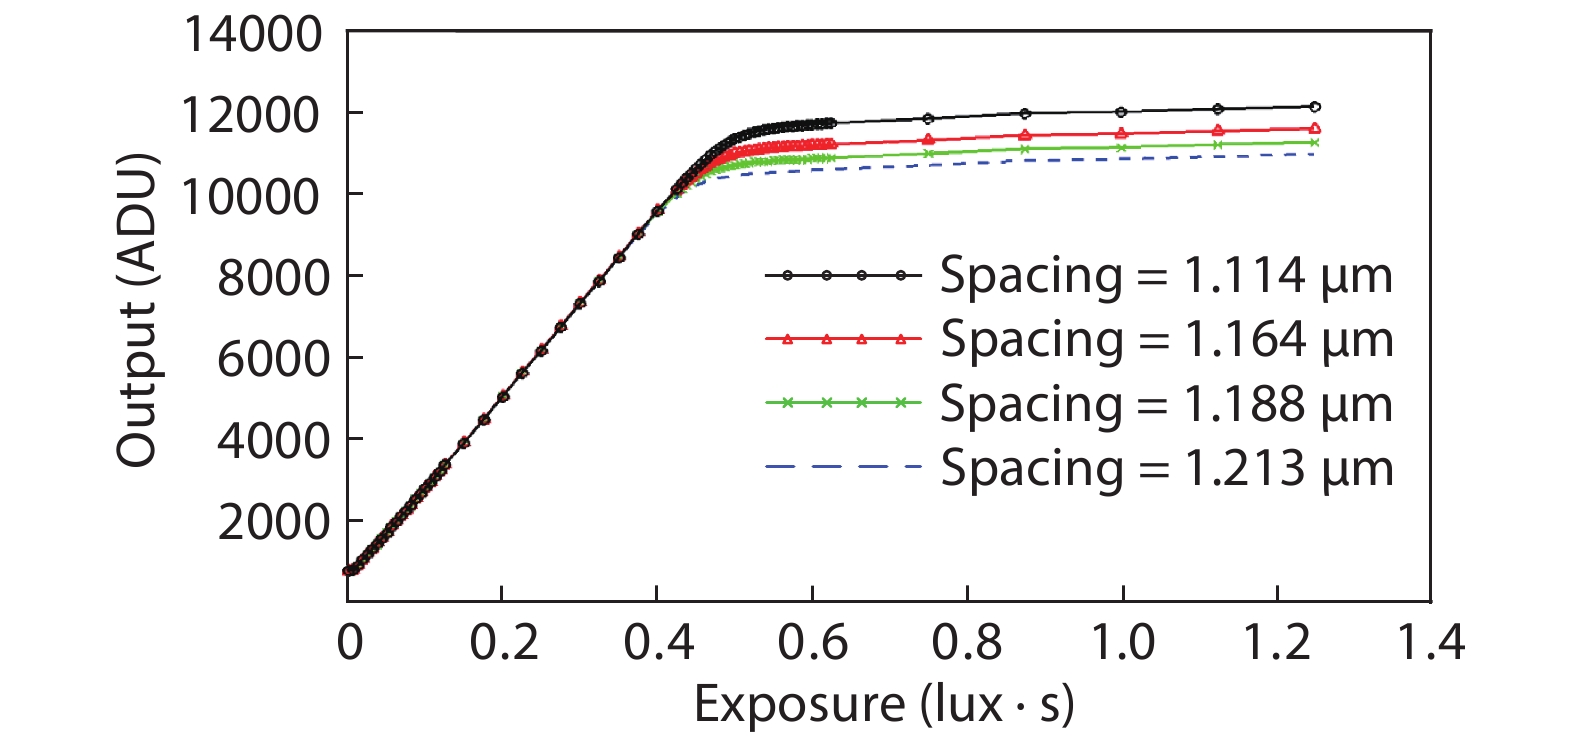
Table 2.   Vpin with different PPD spacing.

Spacing (μm)1.41.31.21.11.00.9
Vpin (V)1.3821.4151.4241.4381.506Not fully depleted
DownLoad: CSV

Table 3.   Performance comparison between the pixel test results with a PPD of finger shape and related literature.

ParameterThis workRef. [20]Ref. [21]Ref. [22]Ref. [23]
Technology0.18 μm CMOS90 nm CMOS0.13 μm CMOS0.18 μm CMOS0.18 μm CMOS
Pixel size (μm2)6.00 × 6.005.86 × 5.865.60 × 5.605.60 × 5.606.50 × 6.50
FWC (e-)686503045023000474506400
DownLoad: CSV
[1]
Bigas M, Cabruja E, Forest J, et al. Review of CMOS image sensor. Microelectron J, 2006, 37(5), 433 doi: 10.1016/j.mejo.2005.07.002
[2]
Luo B, Yang F X, Yan L. Key technologies and research development of CMOS image sensors. IITA International Conference on Geoscience and Remote Sensing, 2010, 322
[3]
Fontaine R. Innovative technology elements for large and small pixel CIS devices. Proc International Image Sensor Workshop (IISW), 2013, 1
[4]
Wang X D, Ye T. Comparative research and future tendency between CMOS and CCD image sensor. Electron Des Eng, 2010, 18(11), 184
[5]
Jan B, Erik J M, Wilco K, et al. Recent developments on large-area CCDs for professional applications. International image sensor workshop. Proc International Image Sensor Workshop (IISW), 2015, 1
[6]
Velichko S, Hynecek J, Johnson R, et al. CMOS global shutter charge storage pixels with improved performance. IEEE Trans Electron Devices, 2015, 63(1), 1 doi: 10.1109/TED.2015.2443495
[7]
Solhusvik J, Kuang J, Lin Z, et al. A comparison of high dynamic range CIS technologies for automotive applications. Proc International Image Sensor Workshop, 2013, 1
[8]
Freedman S D, Boussaid F. A high dynamic range CMOS image sensor with a novel pixel-level logarithmic counter memory. IEEE International Conference on Knowledge-Based Engineering and Innovation (KBEI), 2015, 14
[9]
Takayanagi I, Yoshimura N, Mori K, et al. An 87 dB single exposure dynamic range CMOS image sensor with a 3.0 μm triple conversion gain pixel. Proc International Image Sensor Workshop (IISW), 2017, 30
[10]
Wang R G, Yin Y X, Liang L, et al. A high dynamic range CMOS image sensor with dual charge transfer phase. IEEE International Conference on Solid-State and Integrated Circuit Technology (ICSICT), 2016, 1369
[11]
Yu J T, Li B Q, Yu P P, et al. Two-dimensional pixel image lag simulation and optimization in a 4-T CMOS image sensor. J Semicond, 2010, 31(9), 094011 doi: 10.1088/1674-4926/31/9/094011
[12]
Lofthouse-Smith D D, Soman M R, Allanwood E A H, et al. Image lag optimisation in a 4T CMOS image sensor for the JANUS camera on ESA's JUICE mission to Jupiter. Int Soc Opt Photonics, 2018, 10709, 107091J doi: 10.1117/12.2313686
[13]
Rizzolo S, Goiffon V, Estribeau M, et al. Influence of pixel design on charge transfer performances in CMOS image sensors. IEEE Trans Electron Devices, 2018, 65(3), 1048 doi: 10.1109/TED.2018.2790443
[14]
Orly Y P, Ran G, Yosi S D. A random access photodiode array for intelligent image capture. IEEE Trans Electron Devices, 1991, 38(8), 1772 doi: 10.1109/16.119013
[15]
Iltgen K, Bendel C, Benninghoven A. Optimized time-of-flight secondary ion mass spectroscopy depth profiling with a dual beam technique. J Vac Sci Technol A, 1997, 15(3), 460 doi: 10.1116/1.580874
[16]
Park Y H. Image sensor having self-aligned and overlapped photodiode and method of making same. US Patent 7180151, 2007
[17]
Li Z H. Research on image sensor with ultra wide dynamic range. PhD Thesis, Jilin University, 2016
[18]
Cao X, Gäbler D, Lee C, et al. Design and optimisation of large 4T pixel. Proc Int Image Sensor Workshop (IISW), 2015, 112
[19]
Han L Q. Study on the charge transfer mechanism and noise of CMOS active pixel. PhD Thesis, Tianjin University, 2016
[20]
Oike Y, Akiyama K, Hung L D, et al. An 8.3M-pixel 480 fps global-shutter CMOS image sensor with gain-adaptive column ADCs and 2-on-1 stacked device structure. IEEE Symposium on VLSI Circuits, 2016, 1
[21]
Lim W, Hwang J, Kim D, et al. A low noise CMOS image sensor with a 14-bit two-step single-slope ADC and a column self-calibration technique. IEEE International Conference on Electronics, Circuits and Systems (ICECS), 2015, 51
[22]
Yeh S, Hsieh C. Novel single-slope ADC design for full well capacity expansion of CMOS image sensor. IEEE Sens J, 2013, 13(3), 1012 doi: 10.1109/JSEN.2012.2227706
[23]
Xu R, Ng W C, Yuan J, et al. A 1/2.5 inch VGA 400 fps CMOS image sensor with high sensitivity for machine vision. IEEE J Solid-State Circuits, 2014, 49(10), 2342 doi: 10.1109/JSSC.2014.2345018
1

A compact two-dimensional analytical model of the electrical characteristics of a triple-material double-gate tunneling FET structure

C. Usha, P. Vimala

Journal of Semiconductors, 2019, 40(12): 122901. doi: 10.1088/1674-4926/40/12/122901

2

Interfacial engineering of printable bottom back metal electrodes for full-solution processed flexible organic solar cells

Hongyu Zhen, Kan Li, Yaokang Zhang, Lina Chen, Liyong Niu, et al.

Journal of Semiconductors, 2018, 39(1): 014002. doi: 10.1088/1674-4926/39/1/014002

3

Application of resist-profile-aware source optimization in 28 nm full chip optical proximity correction

Jun Zhu, Wei Zhang, Chinte Kuo, Qing Wang, Fang Wei, et al.

Journal of Semiconductors, 2017, 38(7): 074007. doi: 10.1088/1674-4926/38/7/074007

4

Statistical key variable analysis and model-based control for improvement performance in a deep reactive ion etching process

Chen Shan, Pan Tianhong, Li Zhengming, Jang Shi-Shang

Journal of Semiconductors, 2012, 33(6): 066002. doi: 10.1088/1674-4926/33/6/066002

5

Phase separations in graded-indium content InGaN/GaN multiple quantum wells and its function to high quantum efficiency

Guo Hongying, Sun Yuanping, Yong-Hoon Cho, Eun-Kyung Suh, Hai-Joon Lee, et al.

Journal of Semiconductors, 2012, 33(5): 053001. doi: 10.1088/1674-4926/33/5/053001

6

Full well capacity and quantum efficiency optimization for small size backside illuminated CMOS image pixels with a new photodiode structure

Sun Yu, Zhang Ping, Xu Jiangtao, Gao Zhiyuan, Xu Chao, et al.

Journal of Semiconductors, 2012, 33(12): 124006. doi: 10.1088/1674-4926/33/12/124006

7

A robust and simple two-mode digital calibration technique for pipelined ADC

Yin Xiumei, Zhao Nan, Sekedi Bomeh Kobenge, Yang Huazhong

Journal of Semiconductors, 2011, 32(3): 035001. doi: 10.1088/1674-4926/32/3/035001

8

High contrast ratio, high uniformity multiple quantum well spatial light modulators

Huang Yuyang, Liu H C, Wasilewski Z, Buchanan M, Laframboise S R, et al.

Journal of Semiconductors, 2010, 31(3): 034007. doi: 10.1088/1674-4926/31/3/034007

9

Erase voltage impact on 0.18 μm triple self-aligned split-gate flash memory endurance

Dong Yaoqi, Kong Weiran, Nhan Do, Wang Shiuh-Luen, Lee Gabriel, et al.

Journal of Semiconductors, 2010, 31(6): 064012. doi: 10.1088/1674-4926/31/6/064012

10

A 0.18 μm CMOS inductorless complementary-noise-canceling-LNA for TV tuner applications

Yuan Haiquan, Lin Fujiang, Fu Zhongqian, Huang Lu

Journal of Semiconductors, 2010, 31(12): 125006. doi: 10.1088/1674-4926/31/12/125006

11

Mathematical modeling of nanoscale MOS capacitance in the presence of depletion and energy quantization in a poly-silicon gate

Amit Chaudhry, J. N. Roy

Journal of Semiconductors, 2010, 31(11): 114001. doi: 10.1088/1674-4926/31/11/114001

12

Parameter Extraction for 2-π Equivalent Circuit Modelof RF CMOS Spiral Inductors

Gao Wei, Yu Zhiping

Chinese Journal of Semiconductors , 2006, 27(4): 667-673.

13

A 12-Channel,30Gb/s,0.18μm CMOS Front-End Amplifier for Parallel Optic-Fiber Receivers

Li Zhiqun, Xue Zhaofeng, Wang Zhigong, Feng Jun

Chinese Journal of Semiconductors , 2006, 27(1): 47-53.

14

Design and Implementation of a Novel Area-Efficient Interpolator

Peng Yunfeng, Kong Derui, Zhou Feng

Chinese Journal of Semiconductors , 2006, 27(7): 1164-1169.

15

Monolithically Integrated Optoelectronic Receivers Implemented in 0.25μm MS/RF CMOS

Chen Hongda, Gao Peng, Mao Luhong, Huang Jiale

Chinese Journal of Semiconductors , 2006, 27(2): 323-327.

16

Design,Analysis,and Optimization of a CMOS Active Pixel Sensor

Xu Jiangtao, Yao Suying, Li Binqiao, Shi Zaifeng, Gao Jing, et al.

Chinese Journal of Semiconductors , 2006, 27(9): 1548-1551.

17

An Analytical Threshold Voltage Model for Fully Depleted SOI MOSFETs

Li Ruizhen, Han Zhengsheng

Chinese Journal of Semiconductors , 2005, 26(12): 2303-2308.

18

Monolithic Integration of InGaP/AlGaAs/InGaAs Enhancement/Depletion-Mode PHEMTs

Li Haiou, Zhang Haiying, Yin Junjian, Ye Tianchun

Chinese Journal of Semiconductors , 2005, 26(12): 2281-2285.

19

Full Band Monte Carlo Simulation of Electron Transport in Ge with Anisotropic Scattering Process

Chen, Yong, and, Ravaioli, Umberto, et al.

Chinese Journal of Semiconductors , 2005, 26(3): 465-471.

20

A Novel Depletion- Mode MOS Gated Emitter Shorted Thyristor

Chinese Journal of Semiconductors , 2000, 21(6): 536-541.

1. Wang, X.-Y., Wang, T., Cui, Y.-A. et al. First-principles study of effect of impurity compensation on optical properties of Si | [基于第一性原理研究杂质补偿对硅光电性能的影响]. Wuli Xuebao/Acta Physica Sinica, 2024, 73(11): 116301. doi:10.7498/aps.73.20231814
  • Search

    Advanced Search >>

    GET CITATION

    Feng Li, Ruishuo Wang, Liqiang Han, Jiangtao Xu. Design of CMOS active pixels based on finger-shaped PPD[J]. Journal of Semiconductors, 2020, 41(10): 102301. doi: 10.1088/1674-4926/41/10/102301
    F Li, R S Wang, L Q Han, J T Xu, Design of CMOS active pixels based on finger-shaped PPD[J]. J. Semicond., 2020, 41(10): 102301. doi: 10.1088/1674-4926/41/10/102301.
    shu

    Export: BibTex EndNote

    Article Metrics

    Article views: 3622 Times PDF downloads: 122 Times Cited by: 1 Times

    History

    Received: 25 December 2019 Revised: 13 January 2020 Online: Accepted Manuscript: 10 April 2020Uncorrected proof: 21 April 2020Published: 01 October 2020

    Catalog

      Email This Article

      User name:
      Email:*请输入正确邮箱
      Code:*验证码错误
      Feng Li, Ruishuo Wang, Liqiang Han, Jiangtao Xu. Design of CMOS active pixels based on finger-shaped PPD[J]. Journal of Semiconductors, 2020, 41(10): 102301. doi: 10.1088/1674-4926/41/10/102301 ****F Li, R S Wang, L Q Han, J T Xu, Design of CMOS active pixels based on finger-shaped PPD[J]. J. Semicond., 2020, 41(10): 102301. doi: 10.1088/1674-4926/41/10/102301.
      Citation:
      Feng Li, Ruishuo Wang, Liqiang Han, Jiangtao Xu. Design of CMOS active pixels based on finger-shaped PPD[J]. Journal of Semiconductors, 2020, 41(10): 102301. doi: 10.1088/1674-4926/41/10/102301 ****
      F Li, R S Wang, L Q Han, J T Xu, Design of CMOS active pixels based on finger-shaped PPD[J]. J. Semicond., 2020, 41(10): 102301. doi: 10.1088/1674-4926/41/10/102301.

      Design of CMOS active pixels based on finger-shaped PPD

      DOI: 10.1088/1674-4926/41/10/102301
      More Information
      • Corresponding author: Email: xujiangtao@tju.edu.cn
      • Received Date: 2019-12-25
      • Revised Date: 2020-01-13
      • Published Date: 2020-10-04

      Catalog

        /

        DownLoad:  Full-Size Img  PowerPoint
        Return
        Return