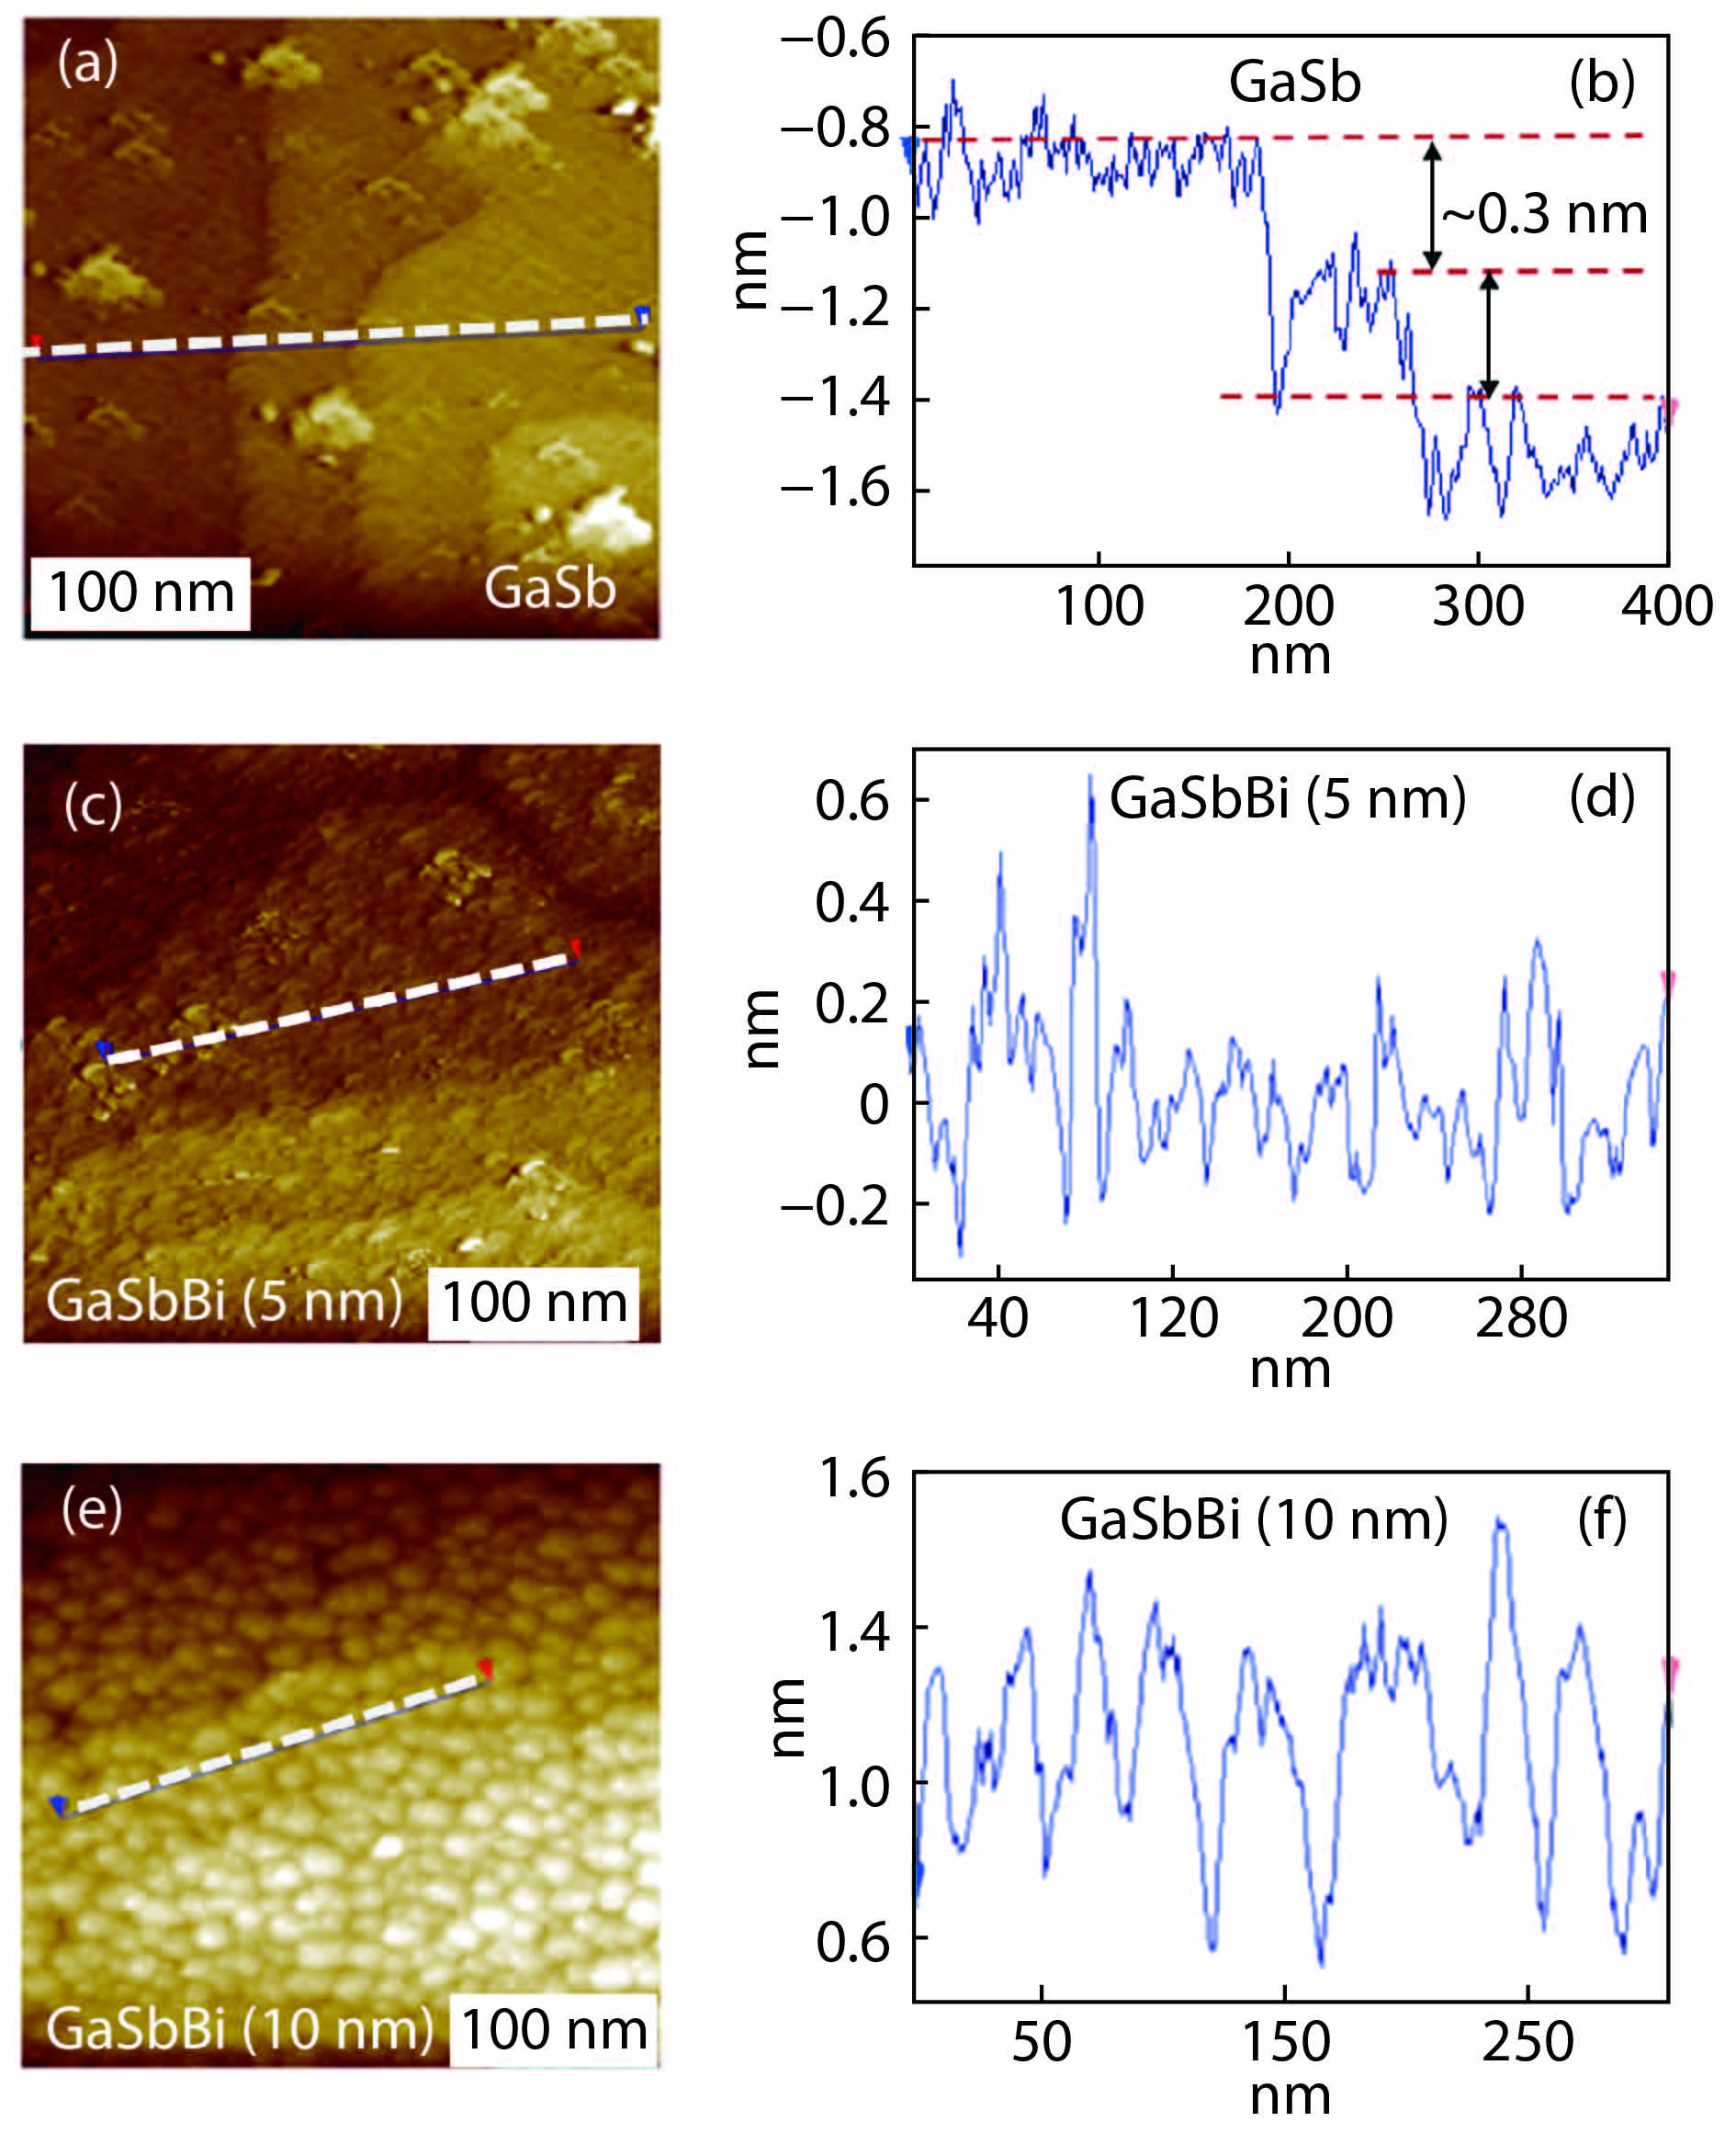
J. Semicond. > 2021, Volume 42 > Issue 9 > 092101

ARTICLES

The scanning tunneling microscopy and spectroscopy of GaSb1–xBix films of a few-nanometer thickness grown by molecular beam epitaxy

Fangxing Zha1, , Qiuying Zhang1, Haoguang Dai1, Xiaolei Zhang2, 3, Li Yue2, Shumin Wang4 and Jun Shao5

+ Author Affiliations

 Corresponding author: Fangxing Zha, fxzha@shu.edu.cn

DOI: 10.1088/1674-4926/42/9/092101

PDF

Turn off MathJax

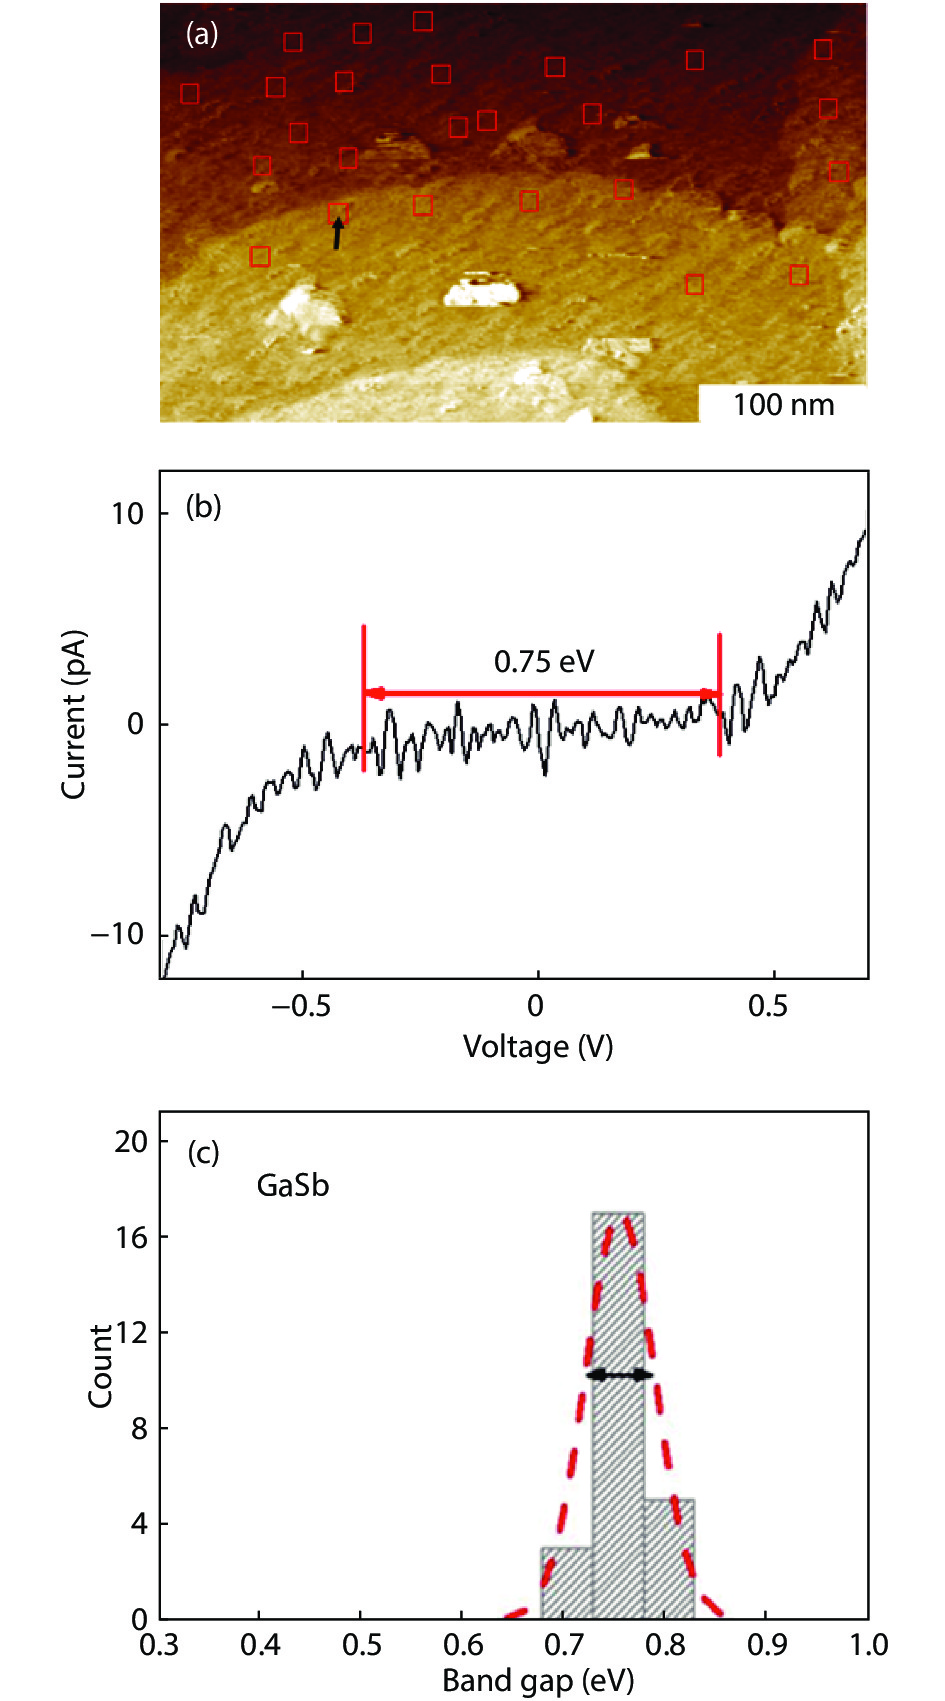
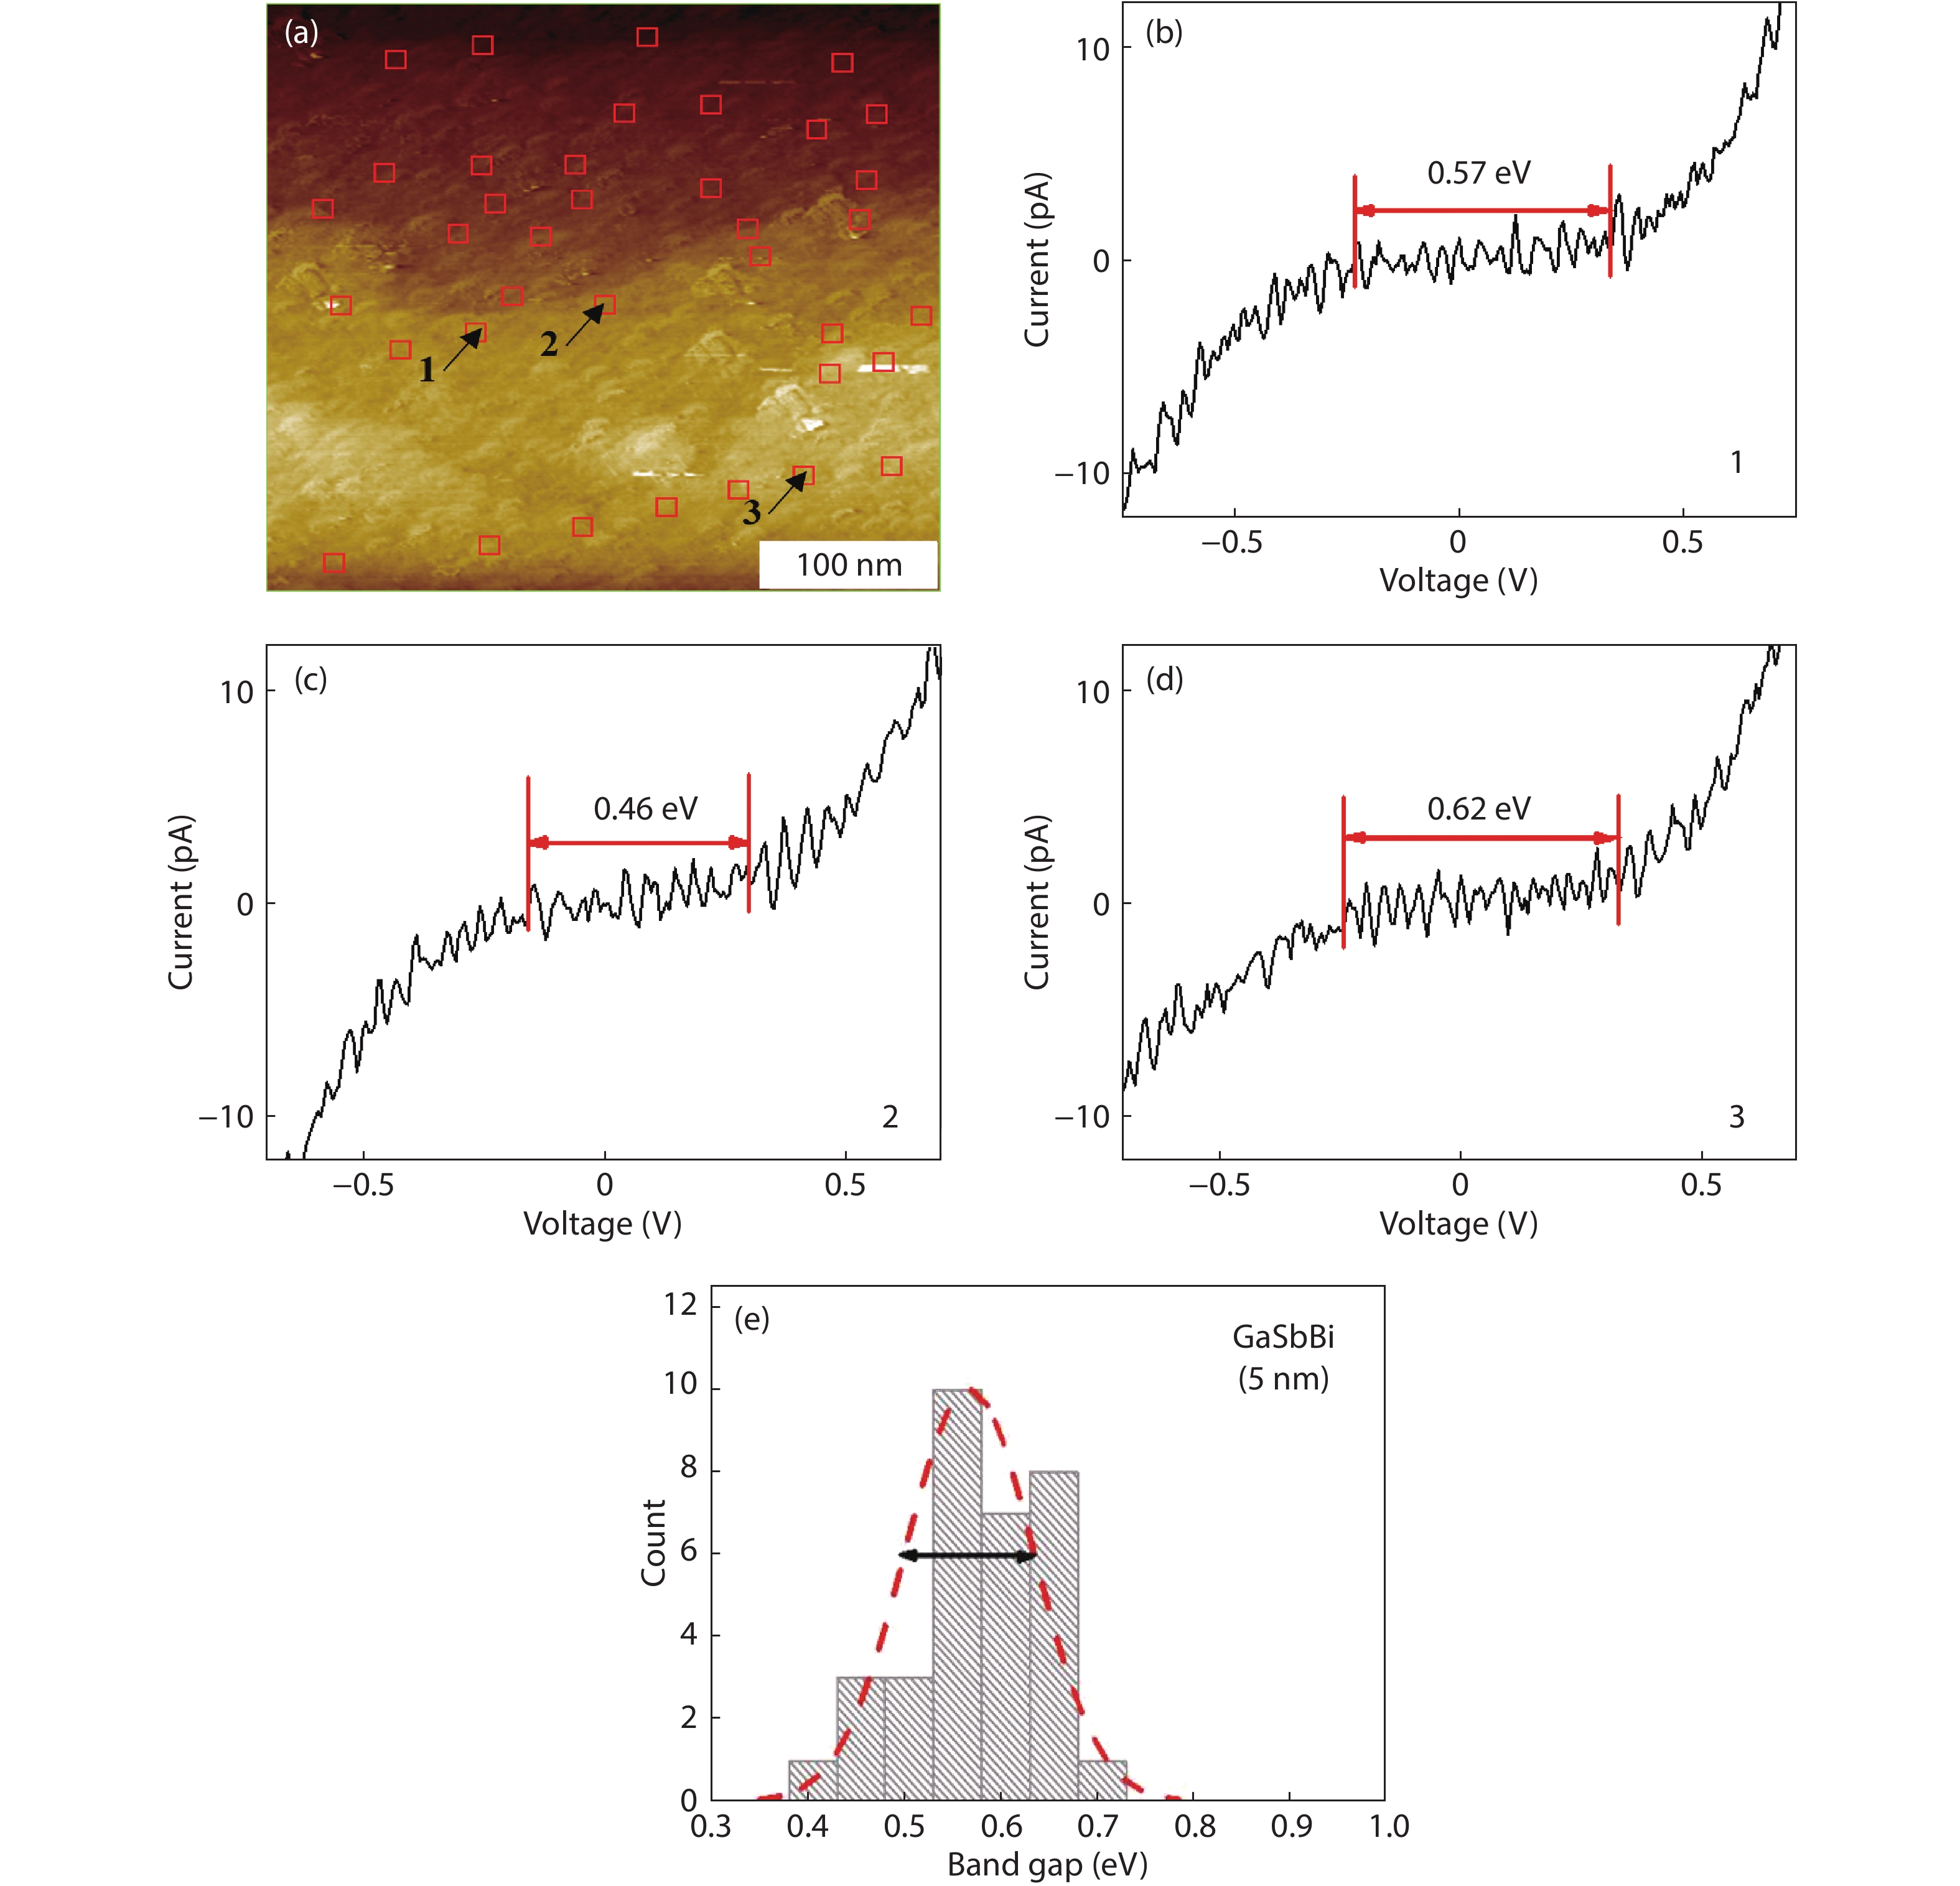
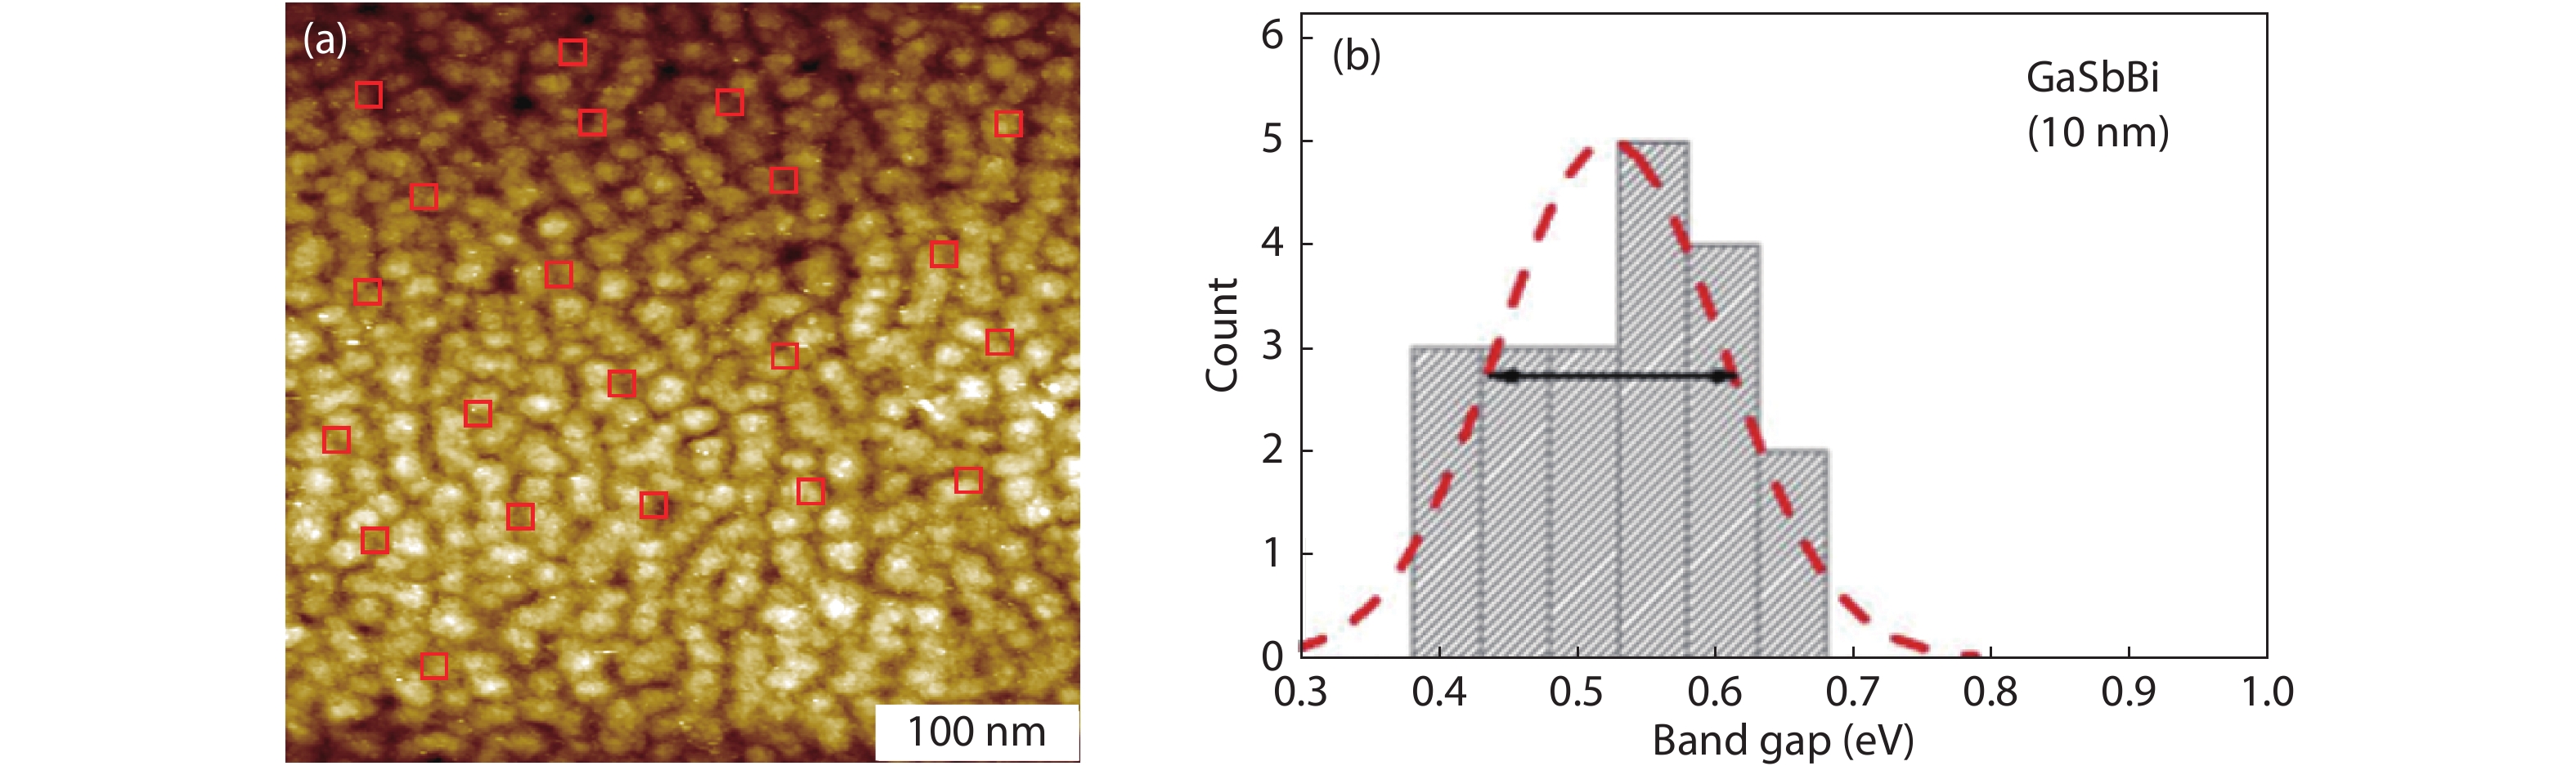
Abstract: The ultrahigh vacuum scanning tunneling microscope (STM) was used to characterize the GaSb1–xBix films of a few nanometers thickness grown by the molecular beam epitaxy (MBE) on the GaSb buffer layer of 100 nm with the GaSb (100) substrates. The thickness of the GaSb1–xBix layers of the samples are 5 and 10 nm, respectively. For comparison, the GaSb buffer was also characterized and its STM image displays terraces whose surfaces are basically atomically flat and their roughness is generally less than 1 monolayer (ML). The surface of 5 nm GaSb1–xBix film reserves the same terraced morphology as the buffer layer. In contrast, the morphology of the 10 nm GaSb1–xBix film changes to the mound-like island structures with a height of a few MLs. The result implies the growth mode transition from the two-dimensional mode as displayed by the 5 nm film to the Stranski–Krastinov mode as displayed by the 10 nm film. The statistical analysis with the scanning tunneling spectroscopy (STS) measurements indicates that both the incorporation and the inhomogeneity of Bi atoms increase with the thickness of the GaSb1–xBix layer.

Key words: scanning tunneling microscopymolecular beam epitaxysemiconductor surface

The diluted-bismuth (Bi) semiconductors attract much attention due to their value for near-/mid-infrared (IR) detectors and lasers[1-5]. For the materials, the incorporation of a small amount of Bi atoms may introduce strong spin-orbit splitting[6] and large energy band-gap reduction[7]. So far, a variety of diluted Bi semiconductors have been reported[1-11]. In particular, GaSb1–xBix attracts much attention due to the smaller band gap of GaSb (0.75 eV at room temperature) having the advantage for the mid-IR device purpose as well as a larger lattice constant (~0.61 nm) to facilitate the incorporation of Bi.

However, the growth of high-quality bismide semiconductors has been a challenge due to the large lattice strain with the incorporation of the Bi atoms. There is still insufficient knowledge on the growth of these largely strained semiconductor films and only a few studies have been concerned with the topic until now[1, 12]. For instance, it was observed that both longitudinal and lateral inhomogeneity of bismuth composition existed with respect to the growth direction[2, 13, 14]. In addition, the epitaxy kinetics of GaSb1–xBix is not yet clearly understood and it is complicated by the morphology instability of the GaSb1–xBix growth, which is affected by a variety of growth parameters such as substrate temperature, growth rate and beam equivalent pressure ratios (BEP)[11-16].

In order to obtain insight into the growth mechanism of GaSb1–xBix epitaxy, it is meaningful to resort to the thin films with only a few atomic layers grown, whose growth is least interfered by the factors like dislocations, miscibility gaps and segregations, which generally accumulate with the growth thickness. Hence, we were motivated to characterize GaSb1–xBix films of a few nanometers thickness. For the purpose, the samples with two GaSb1–xBix layer thicknesses, i.e. 5 and 10 nm, respectively, were grown and characterized with the ultrahigh vacuum scanning tunneling microscope (UHV STM). The measurement shows that the growth mode of epitaxy may change with the increase of layer thickness: the morphology of the 5 nm film implies the two-dimensional (2D) Frank–van der Merwe (FM) growth mode[17] whereas the growth mode turns to the Stranski–Krastinov (SK) mode as manifested by the 10 nm film[18]. Moreover, the analysis on the spatial distribution of STS characterization provides insight into the variation of the bismuth composition with the growth thickness.

GaSb1–xBix was grown on Te-doped n-type GaSb substrates using a DCA P600 MBE system, equipped with a valved cracker Sb cell and dual filament effusion cells for Ga and Bi. After the oxide desorption at 660 °C, a 100 nm undoped GaSb buffer layer was grown at 580 °C. Then, the substrate temperature was cooled down to 340 °C to grow the 5 and 10 nm GaSb1–xBix layer, respectively. All the substrate temperature was measured by a thermocouple, which is estimated to be about 100 °C higher than the real temperature. This difference of temperature was calibrated by observing the critical temperature of 370 °C at which the reflection high-energy electron diffraction (RHEED) reconstruction pattern transforms from (1 × 3) to (1 × 5)[19]. During the growth of GaSb1–xBix, the beam equivalent pressure of Ga, Sb and Bi are fixed at 1.2 × 10⁻⁷, 2.2 × 10⁻⁷ and 8.5 × 10⁻⁹ Torr, respectively, with the growth rate of 0.46 μm/h. The thickness of film is generally determined by the oscillation of the RHEED pattern by which one determines the Ga’s deposition rate in the GaSb layer growth. Consequently, the layer thickness can be calculated and controlled according to the deposition time. The accuracy of thickness control by the method is generally of an error range of 5% of the layer thickness, whose deviation is accurate enough in terms of the 5 and 10 nm layers grown. The samples grown by MBE were characterized by an ultrahigh vacuum scanning tunneling microscope (UHV-STM, the Omicron Inc.) and the imaging parameters of the instrument can be referred to elsewhere[20]. The transfer of samples from the MBE chamber to the STM measurement was protected by a vacuum suitcase so as to minimize the influence of exposure to air.

In order to compare with the results on the minor-layer GaSb1–xBix films, the surface of the GaSb buffer layer was also characterized and the STM image is shown in Fig. 1(a). The morphology displays the terraced structure and the topographic line profile shown in Fig. 1(b) indicates that each terrace is atomically flat and the steps of the terraces have the value of ~ 0.3 nm, which is of a one-monolayer (1 ML) thickness of the (100) GaSb faces. The height fluctuation within a terrace is generally smaller than 1 ML, indicating that the growth mode of epitaxy of the 100 nm GaSb buffer layer belongs to the two-dimensional Frank–van der Merwe (FM) mode[17].

Figure  1.  (Color online) The STM images and topographic line profiles of (a, b) the GaSb buffer layer, (c, d) the 5 nm GaSbBi layer and (e, f) 10 nm GaSbBi layer, respectively.

The result of the 5 nm GaSb1–xBix film is shown in Fig. 1(c). The morphology reserves the same terraced feature as that of the GaSb buffer. The line profile shown in Fig. 1(d) shows that the roughness of the terrace is around ~ 0.4 nm, which is slightly larger than the case of the GaSb surface. This result is interpretable regarding that the lattice constant of GaSb1–xBix is larger than that of GaSb due to the large Bi atoms. Nevertheless, the same terraced feature manifested by 5 nm GaSb1–xBix layer implies that its growth belongs to the same FM mode as that of the GaSb buffer.

In contrast, a distinctive change has been observed for 10 nm GaSb1–xBix film, as shown in Fig. 1(e). The STM image displays the mound-like island morphology. The line profile in Fig. 1(f) reveals that the average height variation is about 0.8 nm, more than 2 MLs thick, indicating that the growth mode is no longer the FM mode but has evolved to the SK mode[18]. We remind that the growth condition in the epitaxy of both 5 and 10 nm films was the same. Hence, we conjecture that the morphology feature observed above may be interpreted by the following mechanism of growth. Note that both the 5 nm GaSbBi and GaSb buffer display the similar terrace structure e.g. in Figs. 1(a) and 1(c), indicating that the step-flow type of 2D growth is preferred in the cases. It further implies that the surface at the initial stage of GaSbBi growth should be reasonably perfect and the step edges are the main locations to capture the diffusive atoms of the surface at this stage. However, the surface imperfection may be developed and the surface inhomogeneity with the localized lattice strain as well as other defects increases with the increased incorporation of Bi atoms. The increased localized imperfections act as the other source of nucleation centers to capture the diffusive atoms of the surface, leading to the transformation of growth mode from FM to SK as observed.

The effect of Bi incorporation in GaSb1–xBix may be evaluated further by the STS measurement since the surface electronic structure is correlated with the Bi composition. An STS spectrum shown herein is acquired in such a way that during the imaging the instrument temporarily suspends tip scanning, moves the STM tip to the desired position, switches off the feedback loop and then conducts a voltage ramp to measure the tunneling current so that an I–V spectrum is produced. For comparing purposes, we first show the STS measurements of the GaSb buffer. A typical I–V spectrum corresponding to the arrow indicated that the position in Fig. 2(a) displays the line-shape with a current plateau at the zero-voltage range. The plateau indicates a gap of 0.75 eV, which is equal to the energy band gap of bulk GaSb at room temperature. We would like to point out that the extraction of the band gap value by the raw I–V data other than by the form of dI/dV or normalized dI/dV is a more accurate assignment herein because the differential of I–V curve is generally noisy and necessarily demands the process of arithmetic data-smoothing, which introduces a larger uncertainty of the assignment. To be more convincible with the extraction of band gap value, a variety of measurements, with the arbitrarily selected positions as the indication of the square labels in Fig. 2(a), were performed. One may obtain a statistical view with the bar graph plot as shown in Fig. 2(c). From the total of twenty-six measurements, the bar graph exhibits the count number for the different energy ranges, which are in an interval of 0.05 eV. The dashed-line curve with the bar graph is the Gaussian distribution calculated with the average plateau width and the corresponding root of mean square (RMS) value, which are 0.757 and 0.034 eV, respectively. The RMS, reflecting the uncertainty of the measurement, is about 4.5% of the mean value and equal to the half-width of the horizontal arrow line designated in Fig. 2(c).

Figure  2.  (Color online) (a) The STM image of the GaSb buffer with the indication of the positions of the STS measurements. The arrow designates the position of the I–V curve shown in (b), which is a typical I–V spectrum of GaSb indicating that the current plateau is approximately equal to the band gap of GaSb. (c) The bar graph on the energy distribution of band gaps based on all measured positions in (a).

Note that the average value of 0.757 eV is approximately equal to the energy band gap of bulk GaSb at 300 K, validating the assignment of the flat band model. Nevertheless, some current plateaus displaying larger values than the intrinsic energy band gap indicates that the tip-induced band bending effect is not negligible with some measurement locations[21, 22]. On the other hand, some other locations display smaller current plateau than the intrinsic band gap. It is likely induced by the local band gap states on tunneling. In addition, some uncertainty is also related to the recognition on the width of the zero-current plateau of the I–V curve. The later influence is roughly of an error of ±0.02 eV. Nonetheless, the zero current plateau is at least a reasonable approximation of the local energy band gap, providing further physical insight through the comparison of the parameter with the different GaSb1–xBix samples, as addressed below.

In the following, we apply the above analysis on the STS results of the GaSb1–xBix films. Fig. 3(a) is the STM image of the 5 nm GaSb1–xBix film, in which the locations of STS measurements are marked with the squares. The measured band gaps with the positions marked in (a) are distributed in a wider energy range of 0.4–0.7 eV. Figs. 3(b)2(d) display three representative I–V curves, which correspond to the arrow-indicated positions with the numbers 1–3 in Fig. 3(a). The mean band gap value calculated with all spectra, is found to be 0.571 eV and the RMS value is 0.059 eV. Note that the RMS herein is about 10% of the mean band gap value, more dispersed than the case of GaSb. Such an effect should arise from the spatial inhomogeneity of the Bi atoms. According to the relationship of the energy band gap and Bi composition x[23], one may find that the value of the energy band gap of 0.571 eV gives rise to the x value of 0.058. With the RMS value shown above, one is able to estimate the spatial variation of Bi composition and find that the x value falls between 0.036 and 0.079.

Figure  3.  (Color online) (a) The STM image of the 5 nm GaSb1–xBix layer with the positions of STS measurements marked and the arrows indicate the positions for the I–V curves shown in (b–d). (e) The bar graph on the distribution of energy band gaps measured with respect to the measurement positions in (a).

In contrast, the analysis of the 10 nm GaSb1–xBix generates a different result. Fig. 4(a) is an STM image of 10 nm film marked with the positions of the STS measurements. The corresponding bar graph resulting from twenty pieces of data is shown in Fig. 4(b). For this sample, the mean energy band gap is found to be 0.531 eV, which is smaller than the result of 5 nm. It corresponds the Bi composition of x = 0.071, larger than that of the 5 nm GaSb1–xBix film which shows x = 0.058. The result implies the increase of Bi incorporation with the layer growth. On the other hand, the RMS value increases to 0.079 eV, which is about 15% of the mean band gap value. Accordingly, the x value is generally in the range of (0.045, 0.097). It means that the spatial inhomogeneity of Bi has also turned to a larger range in the 10 nm GaSb1–xBix film case. The comparison with the calculated Gaussian distributions between Fig. 4(b) and Fig. 3(b) provides an intuitive demonstration on the point.

Figure  4.  (Color online) (a) The STM image of the 10 nm GaSb1–xBix film with the positions of STS measurements indicated. (b) The bar graph on the distribution of energy band gaps measured.

In conclusion, the present study preforms the STM & STS characterization on the GaSb1–xBix films of a few nanometers thickness. The study shows that the growth is initially attributed to the FM growth mode as revealed by the morphology of 5 nm GaSb1–xBix film but is transformed to the SK growth mode subsequently as indicated by that of the 10 nm film. The analysis of the position-dependent STS measurements provides insight into the spatial distribution of Bi composition. The comparison on the 5 and 10 nm films discloses the growth mechanism on the initial epitaxial stage of GaSb1–xBix, indicating that the composition as well as the spatial inhomogeneity of Bi atoms increases with the growth thickness.

This work was supported by the National Natural Science Foundation of China (Nos. 61474073, 61874069 and 61804157).


[1]
Li H D, Wang Z M. Bismuth-containing compounds. New York, NY: Springer New York, 2013
[2]
Luna E, Delorme O, Cerutti L, et al. Microstructure and interface analysis of emerging Ga(Sb, Bi) epilayers and Ga(Sb, Bi)/GaSb quantum wells for optoelectronic applications. Appl Phys Lett, 2018, 112, 151905 doi: 10.1063/1.5024199
[3]
Souto S, Hilska J, Galvão Gobato Y, et al. Raman spectroscopy of GaSb1−xBix alloys with high Bi content. Appl Phys Lett, 2020, 116, 202103 doi: 10.1063/5.0008100
[4]
Pan C B, Zha F X, Song Y X, et al. Spectral and spatial resolving of photoelectric property of femtosecond laser drilled holes of GaSb1−xBix. Opt Lett, 2015, 40, 3392 doi: 10.1364/OL.40.003392
[5]
Delorme O, Cerutti L, Luna E, et al. GaSbBi/GaSb quantum well laser diodes. Appl Phys Lett, 2017, 110, 222106 doi: 10.1063/1.4984799
[6]
Alberi K, Wu J, Walukiewicz W, et al. Valence-band anticrossing in mismatched III-V semiconductor alloys. Phys Rev B, 2007, 75, 045203 doi: 10.1103/PhysRevB.75.045203
[7]
Francoeur S, Seong M J, Mascarenhas A, et al. Band gap of GaAs1−xBix, 0 < x < 3.6%. Appl Phys Lett, 2003, 82, 3874 doi: 10.1063/1.1581983
[8]
Rajpalke M K, Linhart W M, Yu K M, et al. Bi-induced band gap reduction in epitaxial InSbBi alloys. Appl Phys Lett, 2014, 105, 212101 doi: 10.1063/1.4902442
[9]
Shalindar A J, Webster P T, Wilkens B J, et al. Measurement of InAsBi mole fraction and InBi lattice constant using Rutherford backscattering spectrometry and X-ray diffraction. J Appl Phys, 2016, 120, 145704 doi: 10.1063/1.4964799
[10]
Wang S M, Saha Roy I, Shi P X, et al. Growth of GaSb1–xBix by molecular beam epitaxy. J Vac Sci Technol B, 2012, 30, 02B114 doi: 10.1116/1.3672025
[11]
Delorme O, Cerutti L, Luna E, et al. Molecular-beam epitaxy of GaInSbBi alloys. J Appl Phys, 2019, 126, 155304 doi: 10.1063/1.5096226
[12]
Wang L J, Zhang L Y, Yue L, et al. Novel dilute bismide, epitaxy, physical properties and device application. Crystals, 2017, 7, 63 doi: 10.3390/cryst7030063
[13]
Rajpalke M K, Linhart W M, Birkett M, et al. High Bi content GaSbBi alloys. J Appl Phys, 2014, 116, 043511 doi: 10.1063/1.4891217
[14]
Yue L, Chen X, Zhang Y C, et al. Structural and optical properties of GaSbBi/GaSb quantum wells. Opt Mater Express, 2018, 8, 893 doi: 10.1364/OME.8.000893
[15]
Duzik A, Millunchick J M. Surface morphology and Bi incorporation in GaSbBi(As)/GaSb films. J Cryst Growth, 2014, 390, 5 doi: 10.1016/j.jcrysgro.2013.12.001
[16]
Yue L, Chen X, Zhang Y, et al. Molecular beam epitaxy growth and optical properties of high bismuth content GaSb1–xBix thin films. J Alloys Compnds, 2018, 742, 780 doi: 10.1016/j.jallcom.2018.01.329
[17]
Bauer E, van der Merwe J H. Structure and growth of crystalline superlattices: From monolayer to superlattice. Phys Rev B, 1986, 33, 3657 doi: 10.1103/PhysRevB.33.3657
[18]
Yamaguchi K, Yujobo K, Kaizu T. Stranski-Krastanov growth of InAs quantum dots with narrow size distribution. Jpn J Appl Phys, 2000, 39, L1245 doi: 10.1143/JJAP.39.L1245
[19]
Thibado P M, Bennett B R, Shanabrook B V, et al. A RHEED and STM study of Sb-rich AlSb and GaSb (001) surface reconstructions. J Cryst Growth, 1997, 175/176, 317 doi: 10.1016/S0022-0248(96)00982-7
[20]
Zha F X, Hong F, Pan B C, et al. Atomic resolution on the (111)B surface of mercury cadmium telluride by scanning tunneling microscopy. Phys Rev B, 2018, 97, 035401 doi: 10.1103/PhysRevB.97.035401
[21]
Feenstra R M. Tunneling spectroscopy of the (110) surface of direct-gap III–V semiconductors. Phys Rev B, 1994, 50, 4561 doi: 10.1103/PhysRevB.50.4561
[22]
Zha F X, Li M S, Shao J, et al. Implication of exotic topography depths of surface nanopits in scanning tunneling microscopy of HgCdTe. Appl Phys Lett, 2012, 101, 141604 doi: 10.1063/1.4756938
[23]
Polak M P, Scharoch P, Kudrawiec R. First-principles calculations of bismuth induced changes in the band structure of dilute Ga–V–Bi and In–V–Bi alloys: Chemical trends versus experimental data. Semicond Sci Technol, 2015, 30, 094001 doi: 10.1088/0268-1242/30/9/094001
Fig. 1.  (Color online) The STM images and topographic line profiles of (a, b) the GaSb buffer layer, (c, d) the 5 nm GaSbBi layer and (e, f) 10 nm GaSbBi layer, respectively.

Fig. 2.  (Color online) (a) The STM image of the GaSb buffer with the indication of the positions of the STS measurements. The arrow designates the position of the I–V curve shown in (b), which is a typical I–V spectrum of GaSb indicating that the current plateau is approximately equal to the band gap of GaSb. (c) The bar graph on the energy distribution of band gaps based on all measured positions in (a).

Fig. 3.  (Color online) (a) The STM image of the 5 nm GaSb1–xBix layer with the positions of STS measurements marked and the arrows indicate the positions for the I–V curves shown in (b–d). (e) The bar graph on the distribution of energy band gaps measured with respect to the measurement positions in (a).

Fig. 4.  (Color online) (a) The STM image of the 10 nm GaSb1–xBix film with the positions of STS measurements indicated. (b) The bar graph on the distribution of energy band gaps measured.

[1]
Li H D, Wang Z M. Bismuth-containing compounds. New York, NY: Springer New York, 2013
[2]
Luna E, Delorme O, Cerutti L, et al. Microstructure and interface analysis of emerging Ga(Sb, Bi) epilayers and Ga(Sb, Bi)/GaSb quantum wells for optoelectronic applications. Appl Phys Lett, 2018, 112, 151905 doi: 10.1063/1.5024199
[3]
Souto S, Hilska J, Galvão Gobato Y, et al. Raman spectroscopy of GaSb1−xBix alloys with high Bi content. Appl Phys Lett, 2020, 116, 202103 doi: 10.1063/5.0008100
[4]
Pan C B, Zha F X, Song Y X, et al. Spectral and spatial resolving of photoelectric property of femtosecond laser drilled holes of GaSb1−xBix. Opt Lett, 2015, 40, 3392 doi: 10.1364/OL.40.003392
[5]
Delorme O, Cerutti L, Luna E, et al. GaSbBi/GaSb quantum well laser diodes. Appl Phys Lett, 2017, 110, 222106 doi: 10.1063/1.4984799
[6]
Alberi K, Wu J, Walukiewicz W, et al. Valence-band anticrossing in mismatched III-V semiconductor alloys. Phys Rev B, 2007, 75, 045203 doi: 10.1103/PhysRevB.75.045203
[7]
Francoeur S, Seong M J, Mascarenhas A, et al. Band gap of GaAs1−xBix, 0 < x < 3.6%. Appl Phys Lett, 2003, 82, 3874 doi: 10.1063/1.1581983
[8]
Rajpalke M K, Linhart W M, Yu K M, et al. Bi-induced band gap reduction in epitaxial InSbBi alloys. Appl Phys Lett, 2014, 105, 212101 doi: 10.1063/1.4902442
[9]
Shalindar A J, Webster P T, Wilkens B J, et al. Measurement of InAsBi mole fraction and InBi lattice constant using Rutherford backscattering spectrometry and X-ray diffraction. J Appl Phys, 2016, 120, 145704 doi: 10.1063/1.4964799
[10]
Wang S M, Saha Roy I, Shi P X, et al. Growth of GaSb1–xBix by molecular beam epitaxy. J Vac Sci Technol B, 2012, 30, 02B114 doi: 10.1116/1.3672025
[11]
Delorme O, Cerutti L, Luna E, et al. Molecular-beam epitaxy of GaInSbBi alloys. J Appl Phys, 2019, 126, 155304 doi: 10.1063/1.5096226
[12]
Wang L J, Zhang L Y, Yue L, et al. Novel dilute bismide, epitaxy, physical properties and device application. Crystals, 2017, 7, 63 doi: 10.3390/cryst7030063
[13]
Rajpalke M K, Linhart W M, Birkett M, et al. High Bi content GaSbBi alloys. J Appl Phys, 2014, 116, 043511 doi: 10.1063/1.4891217
[14]
Yue L, Chen X, Zhang Y C, et al. Structural and optical properties of GaSbBi/GaSb quantum wells. Opt Mater Express, 2018, 8, 893 doi: 10.1364/OME.8.000893
[15]
Duzik A, Millunchick J M. Surface morphology and Bi incorporation in GaSbBi(As)/GaSb films. J Cryst Growth, 2014, 390, 5 doi: 10.1016/j.jcrysgro.2013.12.001
[16]
Yue L, Chen X, Zhang Y, et al. Molecular beam epitaxy growth and optical properties of high bismuth content GaSb1–xBix thin films. J Alloys Compnds, 2018, 742, 780 doi: 10.1016/j.jallcom.2018.01.329
[17]
Bauer E, van der Merwe J H. Structure and growth of crystalline superlattices: From monolayer to superlattice. Phys Rev B, 1986, 33, 3657 doi: 10.1103/PhysRevB.33.3657
[18]
Yamaguchi K, Yujobo K, Kaizu T. Stranski-Krastanov growth of InAs quantum dots with narrow size distribution. Jpn J Appl Phys, 2000, 39, L1245 doi: 10.1143/JJAP.39.L1245
[19]
Thibado P M, Bennett B R, Shanabrook B V, et al. A RHEED and STM study of Sb-rich AlSb and GaSb (001) surface reconstructions. J Cryst Growth, 1997, 175/176, 317 doi: 10.1016/S0022-0248(96)00982-7
[20]
Zha F X, Hong F, Pan B C, et al. Atomic resolution on the (111)B surface of mercury cadmium telluride by scanning tunneling microscopy. Phys Rev B, 2018, 97, 035401 doi: 10.1103/PhysRevB.97.035401
[21]
Feenstra R M. Tunneling spectroscopy of the (110) surface of direct-gap III–V semiconductors. Phys Rev B, 1994, 50, 4561 doi: 10.1103/PhysRevB.50.4561
[22]
Zha F X, Li M S, Shao J, et al. Implication of exotic topography depths of surface nanopits in scanning tunneling microscopy of HgCdTe. Appl Phys Lett, 2012, 101, 141604 doi: 10.1063/1.4756938
[23]
Polak M P, Scharoch P, Kudrawiec R. First-principles calculations of bismuth induced changes in the band structure of dilute Ga–V–Bi and In–V–Bi alloys: Chemical trends versus experimental data. Semicond Sci Technol, 2015, 30, 094001 doi: 10.1088/0268-1242/30/9/094001
1

Electrical properties and structural optimization of GaN/InGaN/GaN tunnel junctions grown by molecular beam epitaxy

Jun Fang, Fan Zhang, Wenxian Yang, Aiqin Tian, Jianping Liu, et al.

Journal of Semiconductors, 2024, 45(1): 012503. doi: 10.1088/1674-4926/45/1/012503

2

Electrical transport properties of cerium doped Bi2Te3 thin films grown by molecular beam epitaxy

Peng Teng, Tong Zhou, Yonghuan Wang, Ke Zhao, Xiegang Zhu, et al.

Journal of Semiconductors, 2021, 42(12): 122902. doi: 10.1088/1674-4926/42/12/122902

3

Quantum light source devices of In(Ga)As semiconductor self-assembled quantum dots

Xiaowu He, Yifeng Song, Ying Yu, Ben Ma, Zesheng Chen, et al.

Journal of Semiconductors, 2019, 40(7): 071902. doi: 10.1088/1674-4926/40/7/071902

4

Studies of Water V. Five Phonons in Protonic Semiconductor Lattice Model of Pure Liquid Water

Binbin Jie, Chihtang Sah

Journal of Semiconductors, 2017, 38(7): 071001. doi: 10.1088/1674-4926/38/7/071001

5

Progress in complementary metal-oxide-semiconductor silicon photonics and optoelectronic integrated circuits

Hongda Chen, Zan Zhang, Beiju Huang, Luhong Mao, Zanyun Zhang, et al.

Journal of Semiconductors, 2015, 36(12): 121001. doi: 10.1088/1674-4926/36/12/121001

6

A GaAs/GaInP dual junction solar cell grown by molecular beam epitaxy

Pan Dai, Shulong Lu, Lian Ji, Wei He, Lifeng Bian, et al.

Journal of Semiconductors, 2013, 34(10): 104006. doi: 10.1088/1674-4926/34/10/104006

7

The effects of electron irradiation on the optical properties of the organic semiconductor polypyrrole

J. V. Thombare, M. C. Rath, S. H. Han, V. J. Fulari

Journal of Semiconductors, 2013, 34(9): 093001. doi: 10.1088/1674-4926/34/9/093001

8

A different approach for determining the responsivity of n+p detectors using scanning electron microscopy

Omeime Xerviar Esebamen, Göran Thungström, Hans-Erik Nilsson

Journal of Semiconductors, 2012, 33(7): 074002. doi: 10.1088/1674-4926/33/7/074002

9

Electrical characterization of the organic semiconductor Ag/CuPc/Au Schottky diode

Mutabar Shah, M. H. Sayyad, Kh. S. Karimov

Journal of Semiconductors, 2011, 32(4): 044001. doi: 10.1088/1674-4926/32/4/044001

10

Modeling and experimental research on a removal mechanism during chemical mechanical polishing at the molecular scale

An Wei, Zhao Yongwu, Wang Yongguang

Journal of Semiconductors, 2010, 31(11): 116005. doi: 10.1088/1674-4926/31/11/116005

11

Comparison of electron transmittances and tunneling currents in an anisotropic TiNx/HfO2/SiO2/p-Si(100) metal–oxide–semiconductor (MOS) capacitor calculated using exponential- and Airy-wavefunction app

Fatimah A. Noor, Mikrajuddin Abdullah, Sukirno, Khairurrijal

Journal of Semiconductors, 2010, 31(12): 124002. doi: 10.1088/1674-4926/31/12/124002

12

Growth of AlGaAs on GaAs (110) Surface by Molecular Beam Epitaxy

Liu Linsheng, Wang Wenxin, Liu Su, Zhao Hongming, Liu Baoli, et al.

Chinese Journal of Semiconductors , 2007, 28(9): 1411-1414.

13

Analysis of PTCDA/ITO Surface and Interface Using X-ray Photoelectron Spectroscopy and Atomic Force Microscopy

Tang Ning, Shen Bo, Wang Maojun, Yang Zhijian, Xu Ke, et al.

Chinese Journal of Semiconductors , 2006, 27(2): 235-238.

14

Analysis of PTCDA/ITO Surface and Interface Using X-ray Photoelectron Spectroscopy and Atomic Force Microscopy

Ou Guping, Song Zhen, Gui Wenming, Zhang Fujia

Chinese Journal of Semiconductors , 2006, 27(2): 229-234.

15

Temperature Dependence of Vacuum Rabi Splitting in a Single Quantum Dot-Semiconductor Microcavity

Zhu Kadi, Li Waisang

Chinese Journal of Semiconductors , 2006, 27(3): 489-493.

16

Study of NiSi/Si Interface by Cross-Section Transmission Electron Microscopy

Jiang Yulong, Ru Guoping, Qu Xinping, Li Bingzong

Chinese Journal of Semiconductors , 2006, 27(2): 223-228.

17

Electronic Structure of Semiconductor Nanocrystals

Li Jingbo, Wang Linwang, Wei Suhuai

Chinese Journal of Semiconductors , 2006, 27(2): 191-196.

18

1.3μm InGaAs/InAs/GaAs Self-Assembled Quantum Dot Laser Diode Grown by Molecular Beam Epitaxy

Niu Zhichuan, Ni Haiqiao, Fang Zhidan, Gong Zheng, Zhang Shiyong, et al.

Chinese Journal of Semiconductors , 2006, 27(3): 482-488.

19

Passively Mode Locked Diode-End-Pumped Yb∶YAB Laser with High Reflectivity Type Semiconductor Saturable Absorption Mirror

Wang Yonggang, Ma Xiaoyu, Xue Yinghong, Sun Hong,Zhang Zhigang,and Wang Qingyue

Chinese Journal of Semiconductors , 2005, 26(2): 250-253.

20

Material Growth and Device Fabrication of GaAs Based 1.3μm GaInNAs Quantum Well Laser Diodes

Chinese Journal of Semiconductors , 2005, 26(9): 1860-1864.

1. Xiao, Z.-Q., Dai, H.-G., Liu, X.-Y. et al. The scanning tunneling spectra of Hg0.72Cd0.28Te and the model interpretation | [Hg0.72Cd0.28Te 扫描隧道谱的模型解释]. Hongwai Yu Haomibo Xuebao/Journal of Infrared and Millimeter Waves, 2024, 43(3): 300-304. doi:10.11972/j.issn.1001-9014.2024.03.002
2. Zheng, Y.-F., Zhang, P., Wei, S.-H. Phase transition behavior of heterostructural alloys: Effects of size mismatch and site preference. Physical Review B, 2022, 105(21): 214113. doi:10.1103/PhysRevB.105.214113
3. Wu, X., Ke, X., Sui, M. et al. Recent progress on advanced transmission electron microscopy characterization for halide perovskite semiconductors. Journal of Semiconductors, 2022, 43(4): 041106. doi:10.1088/1674-4926/43/4/041106
  • Search

    Advanced Search >>

    GET CITATION

    Fangxing Zha, Qiuying Zhang, Haoguang Dai, Xiaolei Zhang, Li Yue, Shumin Wang, Jun Shao. The scanning tunneling microscopy and spectroscopy of GaSb1–xBix films of a few-nanometer thickness grown by molecular beam epitaxy[J]. Journal of Semiconductors, 2021, 42(9): 092101. doi: 10.1088/1674-4926/42/9/092101
    F X Zha, Q Y Zhang, H G Dai, X L Zhang, L Yue, S M Wang, J Shao, The scanning tunneling microscopy and spectroscopy of GaSb1–xBix films of a few-nanometer thickness grown by molecular beam epitaxy[J]. J. Semicond., 2021, 42(9): 092101. doi: 10.1088/1674-4926/42/9/092101.
    shu

    Export: BibTex EndNote

    Article Metrics

    Article views: 3030 Times PDF downloads: 50 Times Cited by: 3 Times

    History

    Received: 05 March 2021 Revised: 25 April 2021 Online: Accepted Manuscript: 28 May 2021Uncorrected proof: 08 June 2021Published: 01 September 2021

    Catalog

      Email This Article

      User name:
      Email:*请输入正确邮箱
      Code:*验证码错误
      Fangxing Zha, Qiuying Zhang, Haoguang Dai, Xiaolei Zhang, Li Yue, Shumin Wang, Jun Shao. The scanning tunneling microscopy and spectroscopy of GaSb1–xBix films of a few-nanometer thickness grown by molecular beam epitaxy[J]. Journal of Semiconductors, 2021, 42(9): 092101. doi: 10.1088/1674-4926/42/9/092101 ****F X Zha, Q Y Zhang, H G Dai, X L Zhang, L Yue, S M Wang, J Shao, The scanning tunneling microscopy and spectroscopy of GaSb1–xBix films of a few-nanometer thickness grown by molecular beam epitaxy[J]. J. Semicond., 2021, 42(9): 092101. doi: 10.1088/1674-4926/42/9/092101.
      Citation:
      Fangxing Zha, Qiuying Zhang, Haoguang Dai, Xiaolei Zhang, Li Yue, Shumin Wang, Jun Shao. The scanning tunneling microscopy and spectroscopy of GaSb1–xBix films of a few-nanometer thickness grown by molecular beam epitaxy[J]. Journal of Semiconductors, 2021, 42(9): 092101. doi: 10.1088/1674-4926/42/9/092101 ****
      F X Zha, Q Y Zhang, H G Dai, X L Zhang, L Yue, S M Wang, J Shao, The scanning tunneling microscopy and spectroscopy of GaSb1–xBix films of a few-nanometer thickness grown by molecular beam epitaxy[J]. J. Semicond., 2021, 42(9): 092101. doi: 10.1088/1674-4926/42/9/092101.

      The scanning tunneling microscopy and spectroscopy of GaSb1–xBix films of a few-nanometer thickness grown by molecular beam epitaxy

      DOI: 10.1088/1674-4926/42/9/092101
      More Information
      • Fangxing Zha:obtained a doctoral degree from Tuebingen University (Germany) in 2001. He has been a professor of the Physics Department at Shanghai University since 2006. His research highlights the experimental studies on the surface and interface of semiconductors, nano-structures and device physics with the techniques of scanning tunneling microscopy and optical spectroscopies
      • Corresponding author: fxzha@shu.edu.cn
      • Received Date: 2021-03-05
      • Revised Date: 2021-04-25
      • Published Date: 2021-09-10

      Catalog

        /

        DownLoad:  Full-Size Img  PowerPoint
        Return
        Return