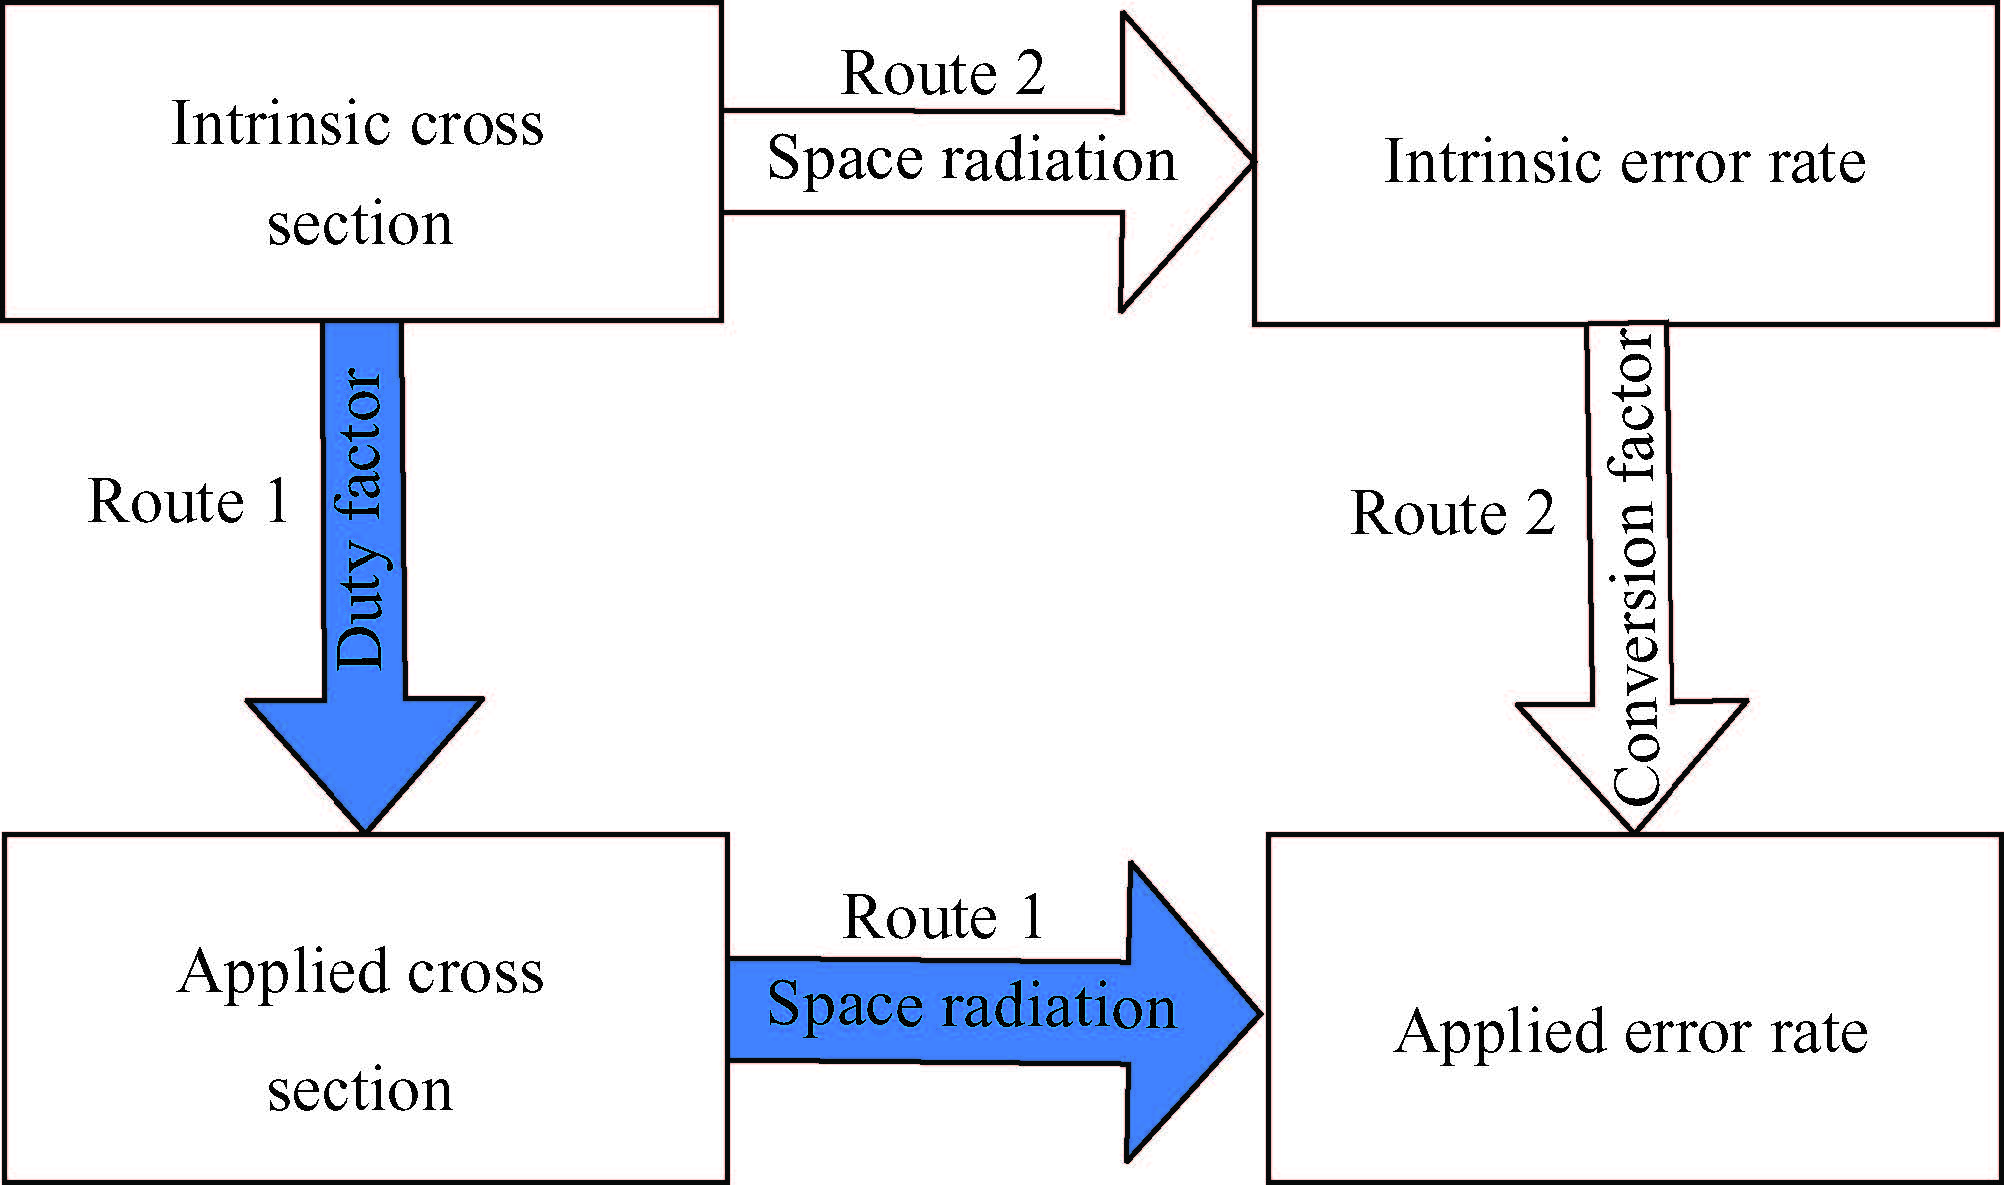
Fig. 1.
Flowchart of error rate prediction.
SEMICONDUCTOR INTEGRATED CIRCUITS
Yuanfu Zhao1, Chunqing Yu1, , Long Fan1, Suge Yue1, 2, Maoxin Chen1, Shougang Du1 and Hongchao Zheng1
Corresponding author: Yu Chunqing, Email: yuchunqing2006@163.com
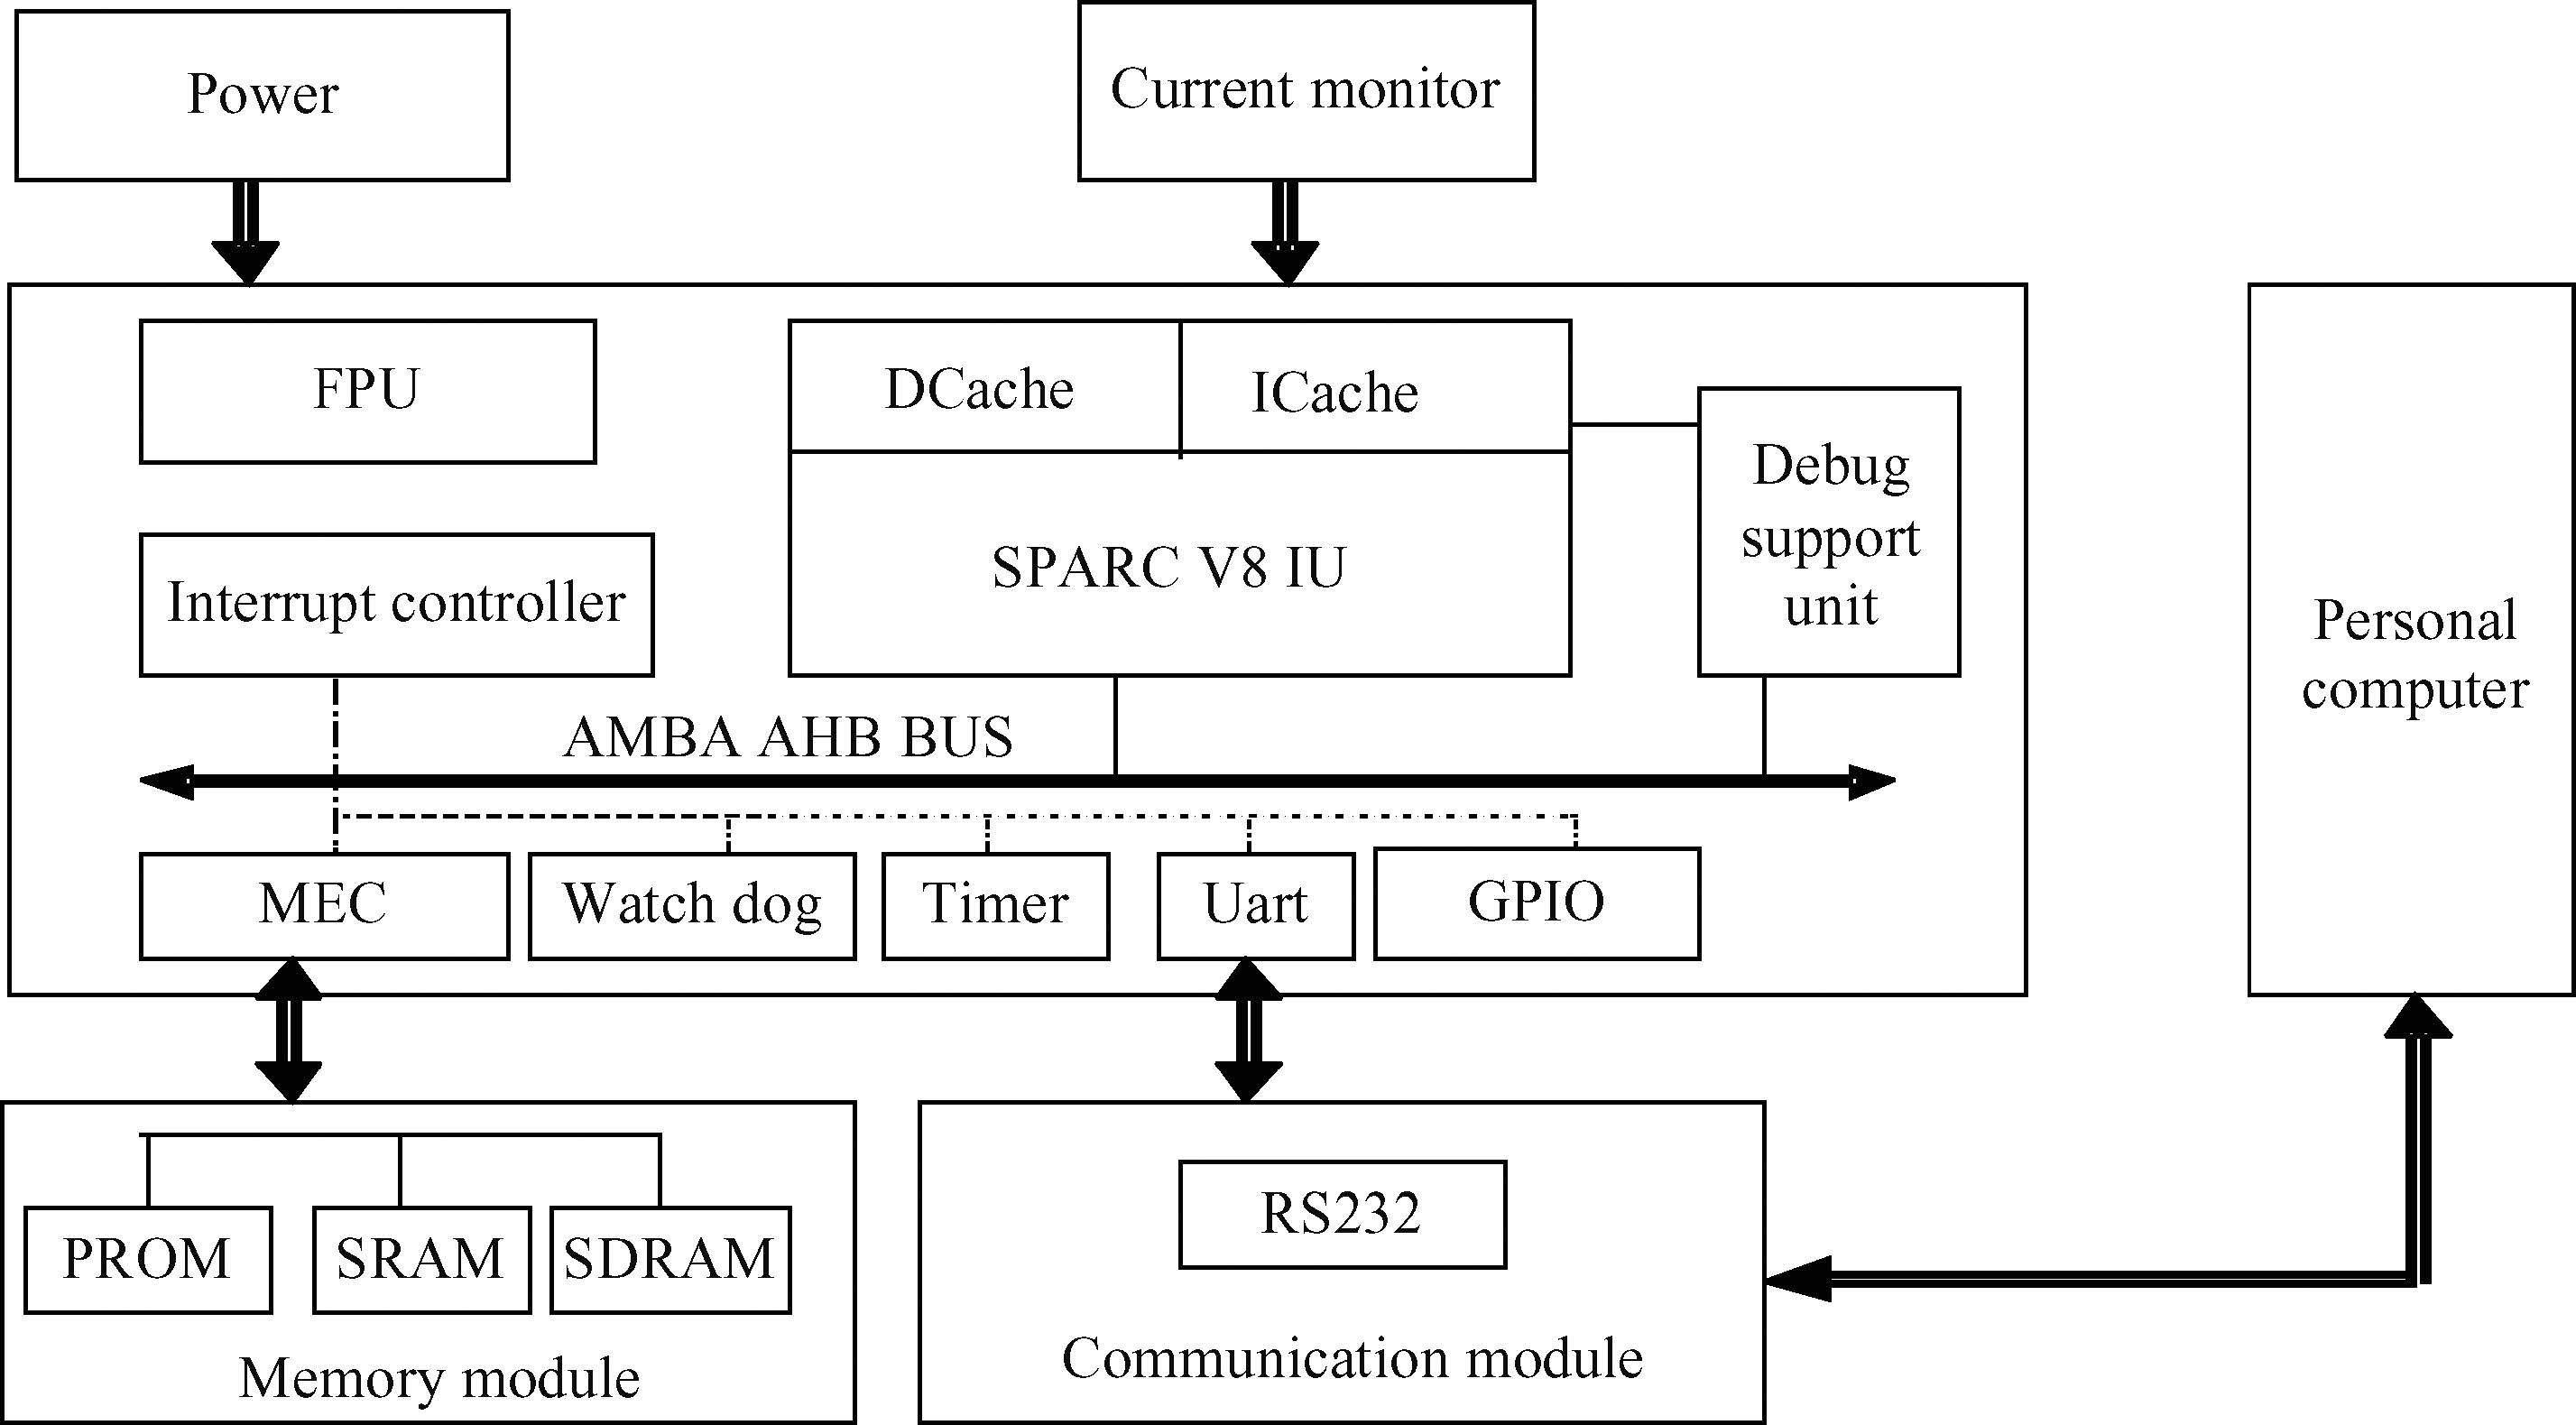
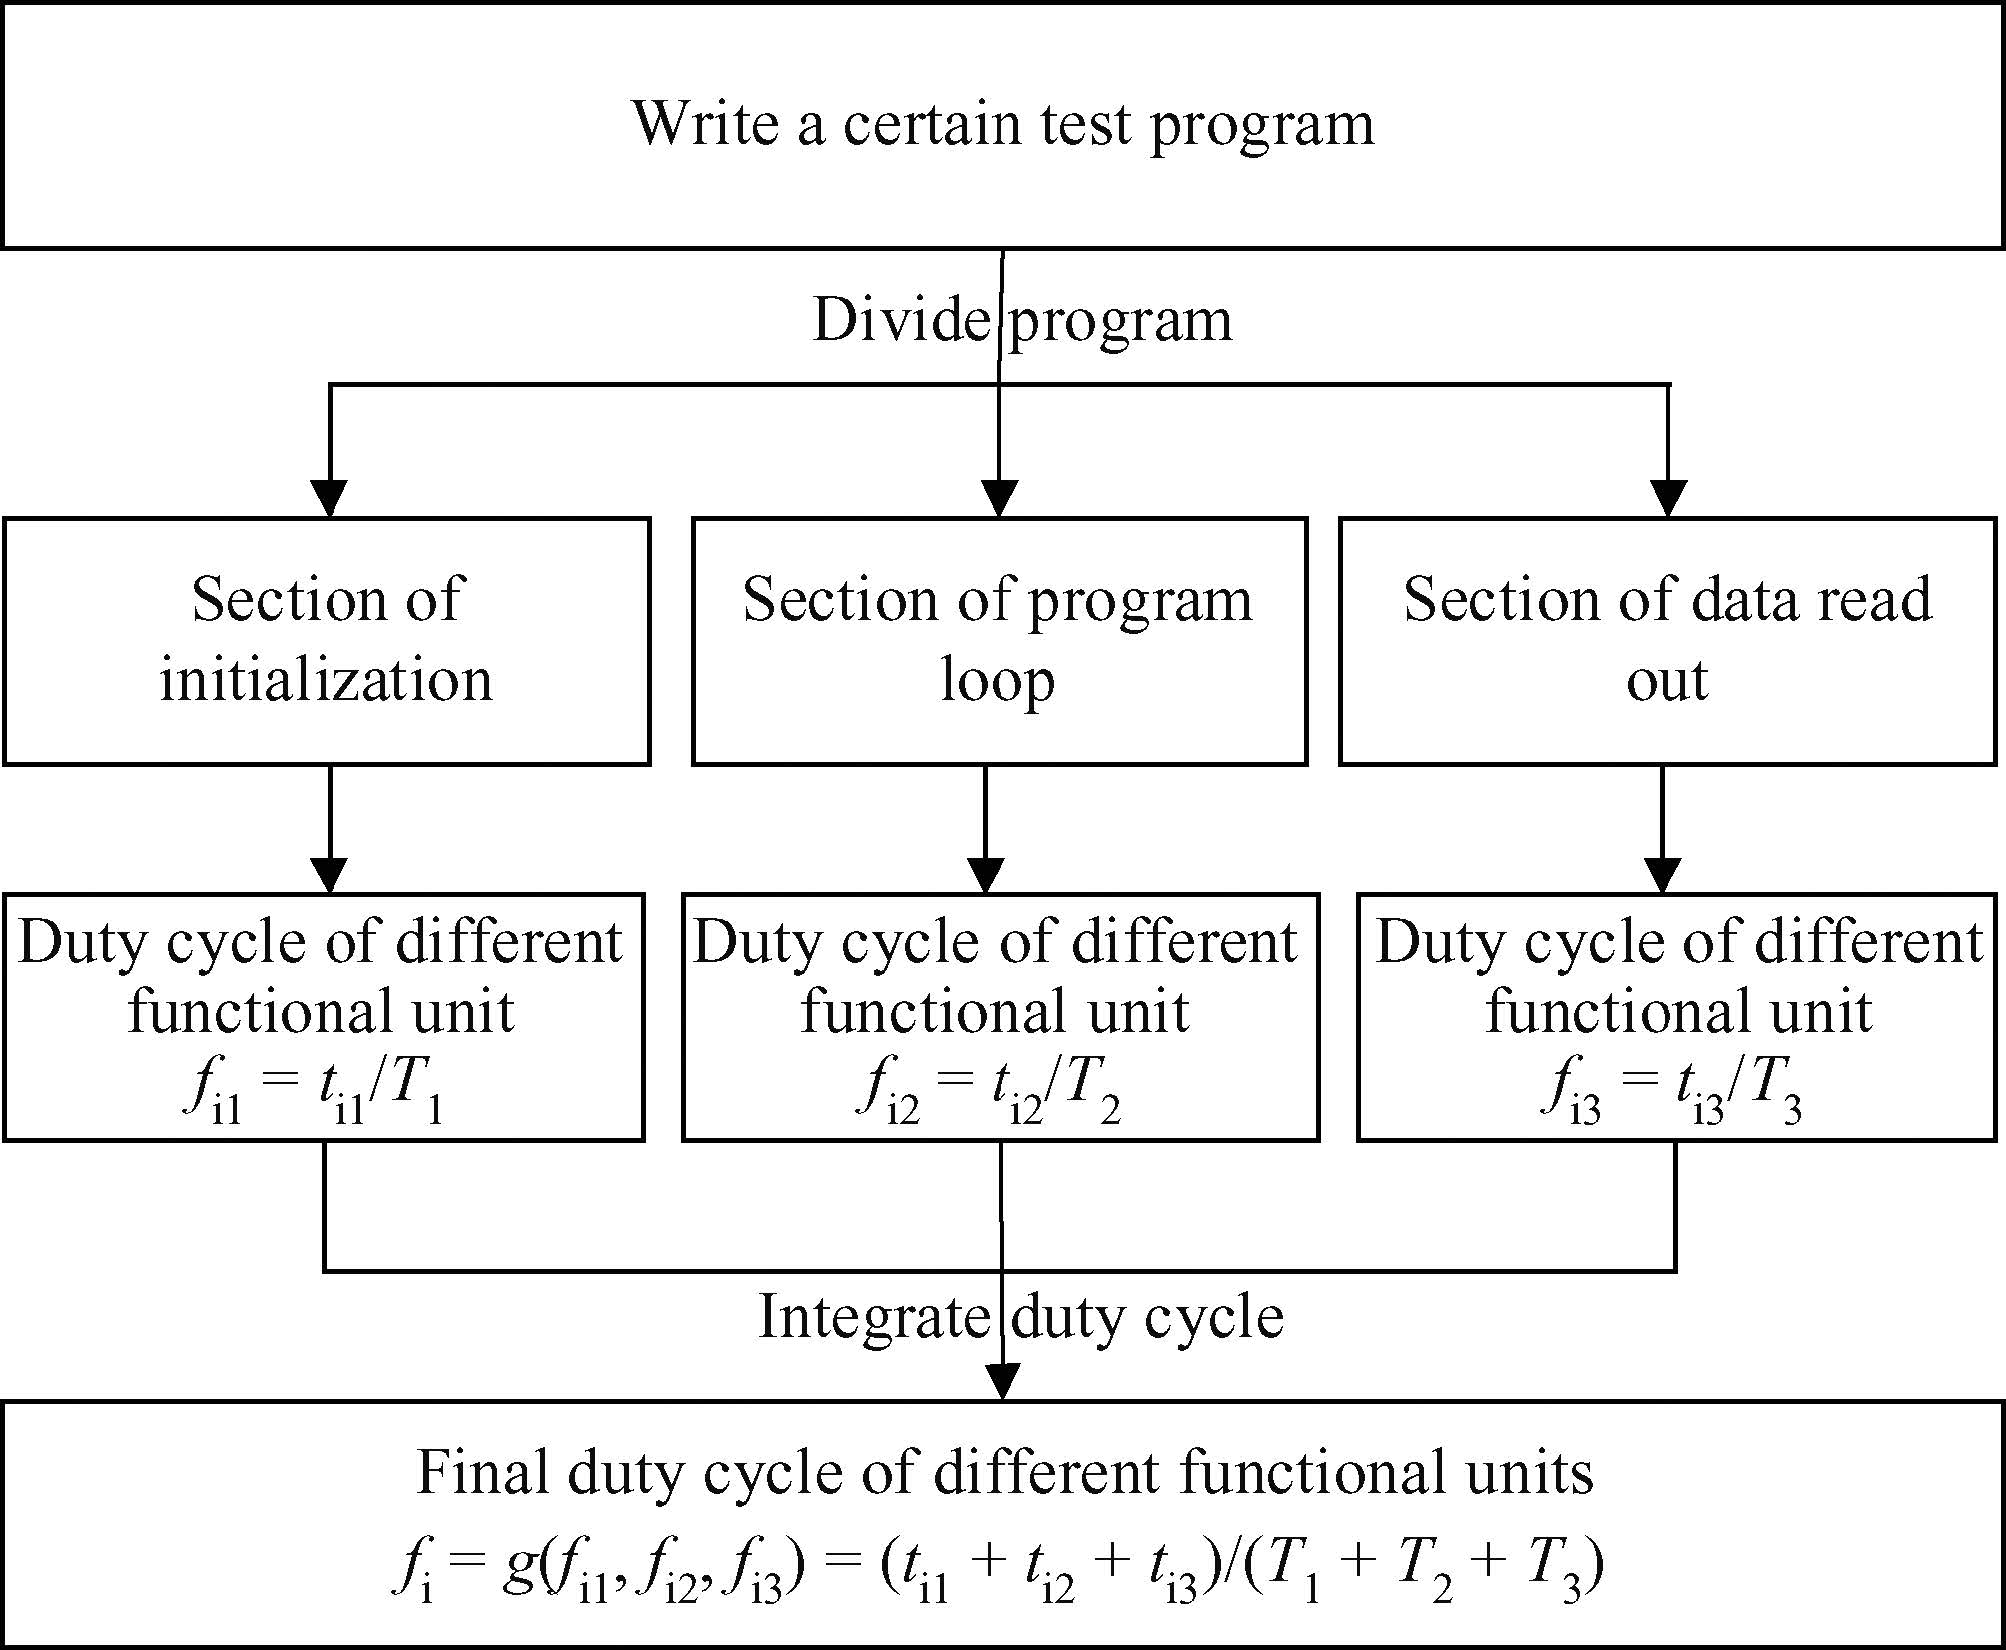
Abstract: The sensitivity of complex integrated circuits to single-event effects is investigated. Sensitivity depends not only on the cross section of physical modules but also on the behavior of data patterns running on the system. A method dividing the main functional modules is proposed. The intrinsic cross section and the duty cycles of different sensitive modules are obtained during the execution of data patterns. A method for extracting the duty cycle is presented and a set of test patterns with different duty cycles are implemented experimentally. By combining the intrinsic cross section and the duty cycle of different sensitive modules, a universal method to predict SEE sensitivities of different test patterns is proposed, which is verified by experiments based on the target circuit of a microprocessor. Experimental results show that the deviation between prediction and experiment is less than 20%.
Keywords: complex ICs, duty cycle, prediction of cross section, prediction techniques
| [1] | |
| [2] | |
| [3] | |
| [4] | |
| [5] |
Table 2. Comparison between prediction results and test results under full functional test mode.
 DownLoad: CSV
| [1] | |
| [2] | |
| [3] | |
| [4] | |
| [5] |


Article views: 3045 Times PDF downloads: 18 Times Cited by: 0 Times
Received: 11 June 2015 Revised: Online: Published: 01 November 2015
| Citation: |
Yuanfu Zhao, Chunqing Yu, Long Fan, Suge Yue, Maoxin Chen, Shougang Du, Hongchao Zheng. A prediction technique for single-event effects on complex integrated circuits[J]. Journal of Semiconductors, 2015, 36(11): 115003. doi: 10.1088/1674-4926/36/11/115003
****
Y F Zhao, C Q Yu, L Fan, S G Yue, M X Chen, S G Du, H C Zheng. A prediction technique for single-event effects on complex integrated circuits[J]. J. Semicond., 2015, 36(11): 115003. doi: 10.1088/1674-4926/36/11/115003.

|
| [1] | |
| [2] | |
| [3] | |
| [4] | |
| [5] |

 WeChat ID
Journal of Semiconductors © 2017 All Rights Reserved 京ICP备05085259号-2