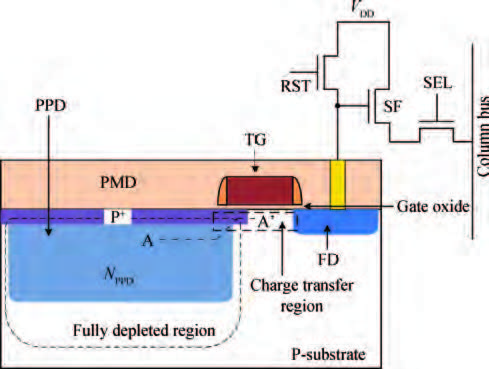
Processing math: 100%
J. Semicond. > 2016, Volume 37 > Issue 5 > 054007

SEMICONDUCTOR DEVICES

Measurement of charge transfer potential barrier in pinned photodiode CMOSimage sensors

Chen Cao, Bing Zhang, Junfeng Wang and Longsheng Wu

+ Author Affiliations
DOI: 10.1088/1674-4926/37/5/054007

PDF

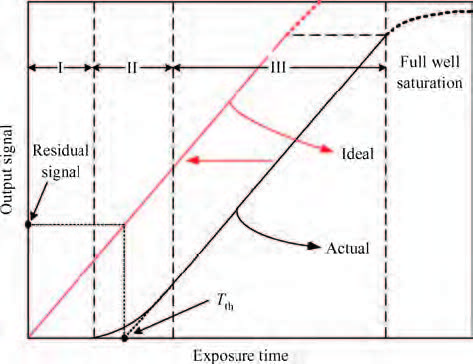
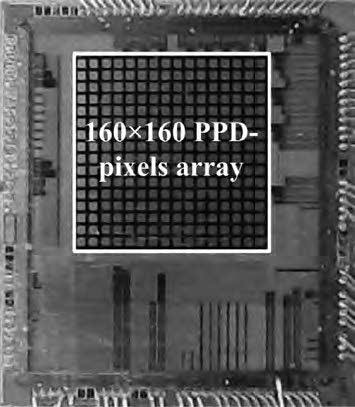
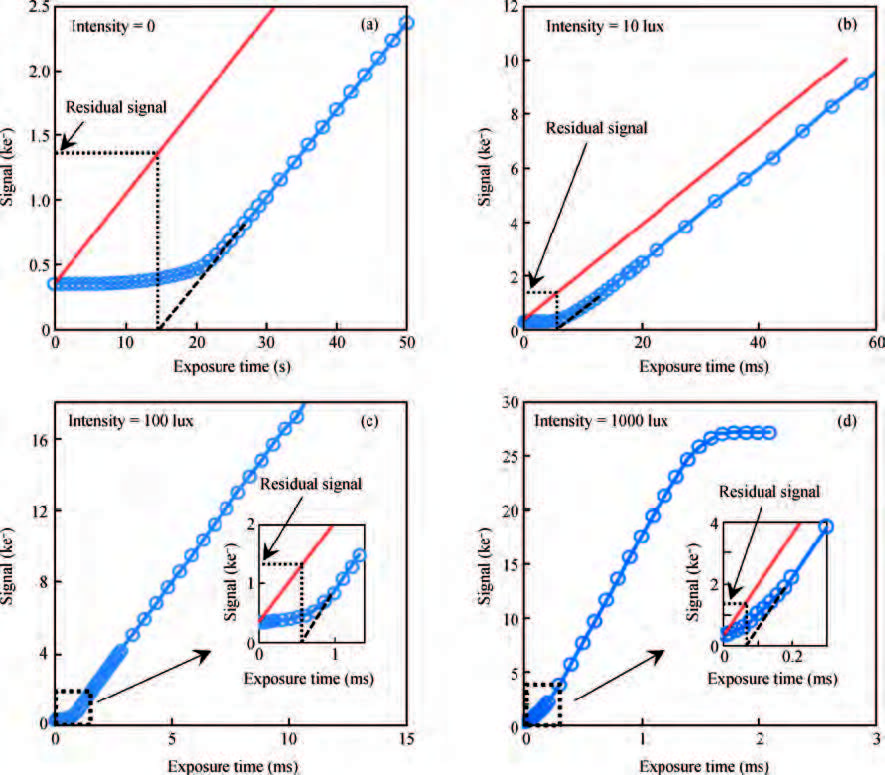
Abstract: The charge transfer potential barrier (CTPB) formed beneath the transfer gate causes a noticeable image lag issue in pinned photodiode (PPD) CMOS image sensors (CIS), and is difficult to measure straightforwardly since it is embedded inside the device. From an understanding of the CTPB formation mechanism, we report on an alternative method to feasibly measure the CTPB height by performing a linear extrapolation coupled with a horizontal left-shift on the sensor photoresponse curve under the steady-state illumination. The theoretical study was performed in detail on the principle of the proposed method. Application of the measurements on a prototype PPD-CIS chip with an array of 160 × 160 pixels is demonstrated. Such a method intends to shine new light on the guidance for the lag-free and high-speed sensors optimization based on PPD devices.

Key words: CMOS image sensors (CIS)pinned photodiode (PPD)charge transfer potential barrier (CTPB)photoresponse curve

CMOS image sensors (CIS) have become promising candidates for solid-state imaging devices over charge coupled devices (CCD) due to the advantages of low power consumption,low cost,and advanced CMOS process compatibility[1, 2, 3]. Pinned photodiodes (PPD),regarded as the most outstanding photodetectors,have been widely employed by state-of-the-art CIS for a growing number of applications based on the strong superiority of the dark current reduction and other benefits[4, 5, 6, 7]. Nevertheless,they can suffer from the incomplete charge transfer due to the complicated electrical properties lying on the photocharge transfer path between the PPD and the floating diffusion (FD) node,thus triggering a critical image lag issue on subsequent frames[8]. One of the most common lag sources is the charge transfer potential barrier[9, 10, 11, 12] (CTPB) introduced in the overlapped area between the PPD and the transfer gate (TG). Traditionally,the height of the CTPB embedded inside the device tends to be evaluated with the help of a potential profile simulation through the TG channel by using TCAD tools as reported in References [10, 11, 12]. However,to the best of authors' knowledge,there has been little understanding up to now of how to experimentally measure the CTPB height.

In this paper,we propose a simple yet powerful method to measure the CTPB height by performing useful transformations on the sensor photoresponse curve under the steady-state illumination,thus providing a more persuasive and valuable evaluation of the CTPB height for guiding pertinently and accurately intrinsic-like charge transfer characteristics optimization in PPD-CIS. A steady and reasonable CTPB height of 48mV has been measured at various light intensity illuminations,through applying the measurement on a prototype PPD-CIS chip with an array of 160×160 pixels.

A typical PPD-based pixel (normally called 4T-pixel) consisting of a PPD with a stack of P+/N/P structure and four func-tional transistors is shown schematically in Figure1. The PPD forms prior to exposure in a fully depleted region,in which the photocharge (electrons) could be collected and stored. The voltage of the FD node is reset to VDD by pulsing the reset transistor RST high. After a period of exposure,the collected photocharge packet is transferred from the PPD to the FD by switching on the TG transistor,and converted to a voltage sig-nal coupled on the FD capacitor. When the select switch SEL conducts,the converted voltage signal is buffered on the column bus by a connecting of a source follower SF.

Figure  图1.  (Color online) Schematic cross-sectional diagram of the PPD and the TG in 4T-pixel.
Fig.1

Despite the existing works that have brought up the concept of the CTPB,the formation mechanism behind the CTPB in PPD-CIS is still to be understood and detailed to support our work physically. Based on a mainstream image sensor process,the buried N-type layer in the PPD is generally implanted subsequent to the polysilicon deposition by using a self-aligned process. It means that the whole N-type layer is isolated by the surface P+-type from the Si--SiO2 interface even within the PPD-TG overlapped area,where the photocharge would be transferred by. When the charge transfer mode is activated after exposure,the TG is pulsed high to establish an inversion NTG channel beneath the gate oxide. However,for pursuing the ultra-low dark current in a 4T-pixel[10, 13],a surface P+-type which has the doping concentration approximately 4--5 times higher than that of the P-substrate tends to be fabricated. In this case,the local P+-type in the PPD-TG overlapped area can hardly be inversed by the high TG pulse during the transfer period,thus remaining a particular P+-type region depleted or still accumulated. Then,a potential barrier (CTPB) is possibly introduced in the overlapped area according to the intrinsic differences of Fermi energy levels between the P-type and the N-type through the charge transfer path. The energy band diagram illustrated in Figure2 facilitates a physical comprehension of the CTPB formation. Notice that,Figure2(a) exhibits only the equilibrium state of the P+/NPPD (with a unified Fermi energy level),which in fact depends on the potential difference between P+ and NPPD as soon as the charge start to transfer. Figure3 shows a TCAD simulation of the potential profile through the transfer path during the charge transferring period in a deep submicron (DSM) process modeled PPD device. It can obvi-ously be observed that a CTPB-induced potential hump with a level of more than 100 mV is dropped in the PPD-TG overlapped area,which prevents the photocharge transferring from the PPD to the FD,resulting in residual (lag) charges in the PPD well.

Figure  图2.  Simplified energy band diagram through the section A-A' indicated in Figure 1 under both states of P+-type in the PPD-TG overlapped area (a) accumulated and (b) depleted. EC, EV and EF represent the conduction band, valence band and Fermi energy level, respectively. The mark “Accu." and “Depl." represent the states of accumulated and depleted, respectively. }
Fig.2
Figure  图3.  Simplified energy band diagram through the section A-A' indicated in Figure 1 under both states of P+-type in the PPD-TG overlapped area (a) accumulated and (b) depleted. EC, EV and EF represent the conduction band, valence band and Fermi energy level, respectively. The mark “Accu." and “Depl." represent the states of accumulated and depleted, respectively. }
Fig.3

It is difficult to measure the CTPB embedded inside PPD-CIS straightforwardly. We focus on exploring an alternative method by utilizing the sensor photoresponse characteristics which could be easily measured. A potential diagram of the charge transfer path as the amount of the collected photocharge in the PPD well increases versus the exposure time is briefly shown in Figure4. Assuming the well capacitance is CPPD,the electrons with a number of N could thereby induce an increasing of the PPD internal potential by qN/CPPD,where q is the charge element. When the exposure time is short,the electron-induced qN/CPPD is much lower than the CTPB height (termed φb

in this paper),causing the situation where almost no charge can be transferred out of the PPD well during the TG pulse duration to create an output signal response. As the exposure time increases,a widely known phenomena of thermionic emission[14, 15] starts to dominate the transfer process; when qN/CPPD is close toφb
,the thermionic emission current and the corresponding charge that jumped across the CTPB can be described respectively by:

Iiump=KT2exp(qqN/CppDφbkT),
(1)
Qjump=kT2exp(qqN/CPPDϕbkT)tTGON,
(2)
(Color online) Simplified electrostatic potential diagram of the charge transfer path for three typical districts as the collected charge increase in the PPD. (I) When qN/CPPD<b: almost no charge transfer. (II) When qN/CPPD is close enough to <b: thermionic emission. (III) When qN/CPPD>b: meaningful charge transfer.TG-OFF and TG-INV are the TG channel potential with the states of TG “OFF" and “ON", respectively. 图4 Fig.4

where K is a physical constant depending on the material,tTGON

is the TG pulse duration,k is the Boltzmann constant,and T is the temperature. As the exposure time continues to increase,the meaningful transfer process starts once qN/CPPD grows higher than φb
,causing an expected dependence of the sensor output signal on the exposure time. The corresponding measured photoresponse curve is qualitatively depicted in Figure5,in which the three charge transfer districts described above are clearly identified. The photocurrent can be regarded as a constant under the steady-state illumination since it depends on the wavelength-dependent photon flux \varphi (\lambda ) and the wavelength-dependent quantum efficiency η(λ)
by:

Iph=qλφ(λ)η(λ)dλ.
(3)
(Color online) Qualitative photoresponse curve with the identified three charge transfer districts depicted in Figure 3, along with the corresponding diagram of the proposed CTPB measurement method. 图5 Fig.5

Therefore,the segment of the photoresponse curve in district III [see Figure5] would present a linear dependence of the output signal as a function of the exposure time according to:

dVdt=IphCGq,
(4)
where CG is the overall electron to voltage conversion gain from the PPD to the sensor output. The voltage dependence of CPPD[16] has been neglected here. Based on the analysis above,a linear extrapolation of the measured segmental curve in district III is performed,as shown in Figure5. We record the exposure time when the output signal reaches zero as Tth,which is defined in this paper as the threshold exposure duration before the starting of the photocharge transfer. In other words,PPD internal potential needs an increased duration of Tth to exceed over the CTPB. A horizontal left-shift of the linear-extrapolated curve is performed subsequently until Tth meets the coordinate origin to obtain a completely linear photoresponse curve (the ideal one plotted in Figure5) that fits the case without a CTPB located on the charge transfer path. Afterwards,we can easily mark out the CTPB-induced residual signal level based on the ideal curve when the exposure time meets the previous Tth [see Figure5]. The residual charge Qres
,actually blocked by the CTPB,can then be further deduced in terms of the derived residual signal level. Eventually,the desired CTPB height is given by:
φb=QresCPPD,
(5)
where CPPD
can be measured as a mean value,thanks to Chao's work[16].

A prototype chip with an array of 160×160 6--pitch conventional PPD-pixels was fabricated using a DSM 1P4M CIS technology. The micrograph of the chip is shown in Figure6. Both schemes of the self-aligned process and a much higher surface P+-type doping level (3×

1019cm-3,compared to 1015cm-3 of P-substrate) were achieved to boost the CTPB as a dominant lag source to meet our measurement purposes. The chip output is the digital signal (DN) that is converted by a 14-bit analog to digital convertor with correlated double sampling. The TG pulse time for the charge transfer is set empirically to 40 μs
to guarantee a saturated transfer[17] during the thermionic emission process. The chip coupled with the printed circuit board (PCB) under test is placed in a dark room. The steady-state illumination with an adjustable intensity is produced by the lamps dropped in an integrating sphere. The specific value of the light intensity can be read out by an intensity monitor. The overall experimental environment is exhibited in Figure7. The photoresponse curve is generated by sweeping the exposure time.

Figure  图6.  Micrograph of the prototype CIS chip with an array of 160×160 PPD-pixels.
Fig.6
Figure  图7.  Photograph of the experimental environment for the CTPB measurement.
Fig.7

Figure8 shows the sensor photoresponse measured curves under different light intensity conditions of 0,10,100,and 1000 lux,and the corresponding CTPB-induced residual sig-nals are also marked according to the main idea of this paper. It is observed that,a fixed signal of

350e- is introduced as soon as turning on the exposure in each measured curve. This phe-nomena indicates that a non-ignorable noise mainly originated by charge partition[18] is coupled on the FD capacitor when the TG gets switched off from the on-state after transferring the photocharge. In this regard,all the left-shifted curves need to be upraised by adding this noise signal portion when the exposure time reaches zero,as what were presented in the measured curves. After marking out the residual signal from each ideal curve,an equal residual level of
1350e- is acquired,demon-strating that the CTPB height is independent of light intensity,but probably depends on the intrinsic properties of the device (e.g.,layout structure,doping profile,crystal defect,etc.) in a specific electrical environment. This feature is consistent with the one reported in Reference [12]. Further calculation obtains φb
= 48 mV according to Equation (5) (the measured mean value of CPPD is 4.5 fF). Notice that,a deviation ofφb
between the measured level and the simulated level in Figure3 might be caused by specific differences of the PPD-TG overlapped doping and geometrical conditions between the fabricated device and the simulated device. In addition,the proposed CTPB measurement under dark conditions [see Figure8(a)] is a time-consuming process due to a relatively slow thermal generation that contributes to the dark current. However,despite the fact the measurement under illumination is fast enough,the short duration of the district I depicted in Figure4 proves the inconvenience in marking residual signals [see Figures 8(c) and 8(d)]. As a result,an appropriate light intensity should be selected carefully within a specific measurement by taking into account a tradeoff between time consumption and operational convenience.

Figure  图8.  (Color online) Photoresponse curves and the extracted CTPB-induced residual signals under light intensities of (a) 0, (b) 10, (c) 100 and (d) 1000 lux, respectively. The blue and the red curves represent the measured curve and the lift-shifted curve, respectively. The output signal is directly evaluated as a unit of e by dividing the \textit{CG} (0.35DN/e) from the measured DN value.
Fig.8

An alternative measurement technique to extract the height of the CTPB embedded inside the photocharge transfer path in the PPD-CIS has been proposed by performing useful transformations on the sensor photoresponse curve. The method has been detailed theoretically and validated experimentally under various light intensity illuminations. The independence of the CTPB on light intensity has also been demonstrated. With the new technique presented in this paper,it becomes feasible to provide pertinently and accurately lag-free and high-speed sensors optimization with an insightful point of view.

The authors would like to acknowledge Benlan Shen and Jiling Liu of LUSTER Light Tech.,Hui Yan of Xi'an Microelectronics Technology Institute,for their fruitful discussions.


[1]
[2]
[3]
[4]
[5]
[6]
[7]
[8]
[9]
[10]
[11]
[12]
[13]
[14]
[15]
[16]
[17]
[18]
图1.  (Color online) Schematic cross-sectional diagram of the PPD and the TG in 4T-pixel.

Fig.1


图2.  Simplified energy band diagram through the section A-A' indicated in Figure 1 under both states of P+-type in the PPD-TG overlapped area (a) accumulated and (b) depleted. EC, EV and EF represent the conduction band, valence band and Fermi energy level, respectively. The mark “Accu." and “Depl." represent the states of accumulated and depleted, respectively. }

Fig.2


图3.  Simplified energy band diagram through the section A-A' indicated in Figure 1 under both states of P+-type in the PPD-TG overlapped area (a) accumulated and (b) depleted. EC, EV and EF represent the conduction band, valence band and Fermi energy level, respectively. The mark “Accu." and “Depl." represent the states of accumulated and depleted, respectively. }

Fig.3


.  (Color online) Simplified electrostatic potential diagram of the charge transfer path for three typical districts as the collected charge increase in the PPD. (I) When qN/CPPD<b: almost no charge transfer. (II) When qN/CPPD is close enough to <b: thermionic emission. (III) When qN/CPPD>b: meaningful charge transfer.TG-OFF and TG-INV are the TG channel potential with the states of TG “OFF" and “ON", respectively.

Fig.4


.  (Color online) Qualitative photoresponse curve with the identified three charge transfer districts depicted in Figure 3, along with the corresponding diagram of the proposed CTPB measurement method.

Fig.5


图6.  Micrograph of the prototype CIS chip with an array of 160×160 PPD-pixels.

Fig.6


图7.  Photograph of the experimental environment for the CTPB measurement.

Fig.7


图8.  (Color online) Photoresponse curves and the extracted CTPB-induced residual signals under light intensities of (a) 0, (b) 10, (c) 100 and (d) 1000 lux, respectively. The blue and the red curves represent the measured curve and the lift-shifted curve, respectively. The output signal is directly evaluated as a unit of e by dividing the \textit{CG} (0.35DN/e) from the measured DN value.

Fig.8


DownLoad: CSV
DownLoad: CSV
DownLoad: CSV
DownLoad: CSV
DownLoad: CSV
[1]
[2]
[3]
[4]
[5]
[6]
[7]
[8]
[9]
[10]
[11]
[12]
[13]
[14]
[15]
[16]
[17]
[18]
1

A low-power high-quality CMOS image sensor using 1.5 V 4T pinned photodiode and dual-CDS column-parallel single-slope ADC

Wenjing Xu, Jie Chen, Zhangqu Kuang, Li Zhou, Ming Chen, et al.

Journal of Semiconductors, 2022, 43(8): 082401. doi: 10.1088/1674-4926/43/8/082401

2

Precision photonic integration for future large-scale photonic integrated circuits

Xiangfei Chen

Journal of Semiconductors, 2019, 40(5): 050301. doi: 10.1088/1674-4926/40/5/050301

3

Column readout circuit with improved offset mismatch and charge sharing for CMOS image sensor

Zhongjie Guo, Ningmei Yu, Longsheng Wu

Journal of Semiconductors, 2019, 40(12): 122404. doi: 10.1088/1674-4926/40/12/122404

4

Hot electron effects on the operation of potential well barrier diodes

M. Akura, G. Dunn, M. Missous

Journal of Semiconductors, 2019, 40(12): 122101. doi: 10.1088/1674-4926/40/12/122101

5

Effect of ultrasound on reverse leakage current of silicon Schottky barrier structure

O.Ya Olikh, K.V. Voitenko, R.M. Burbelo, JaM. Olikh

Journal of Semiconductors, 2016, 37(12): 122002. doi: 10.1088/1674-4926/37/12/122002

6

High-stage analog accumulator for TDI CMOS image sensors

Jianxin Li, Fujun Huang, Yong Zong, Jing Gao

Journal of Semiconductors, 2016, 37(2): 025001. doi: 10.1088/1674-4926/37/2/025001

7

Inhomogeneous barrier height effect on the current-voltage characteristics of an Au/n-InP Schottky diode

Kamal Zeghdar, Lakhdar Dehimi, Achour Saadoune, Nouredine Sengouga

Journal of Semiconductors, 2015, 36(12): 124002. doi: 10.1088/1674-4926/36/12/124002

8

Model development for analyzing 2DEG sheet charge density and threshold voltage considering interface DOS for AlInN/GaN MOSHEMT

Devashish Pandey, T.R. Lenka

Journal of Semiconductors, 2014, 35(10): 104001. doi: 10.1088/1674-4926/35/10/104001

9

Pinch-off voltage modeling for CMOS image pixels with a pinned photodiode structure

Chen Cao, Bing Zhang, Longsheng Wu, Xin Li, Junfeng Wang, et al.

Journal of Semiconductors, 2014, 35(7): 074012. doi: 10.1088/1674-4926/35/7/074012

10

Potential of asymmetrical Si/Ge and Ge/Si based hetero-junction transit time devices over homo-junction counterparts for generation of high power

Moumita Mukherjee, Pravash R. Tripathy, S. P. Pati

Journal of Semiconductors, 2011, 32(11): 113001. doi: 10.1088/1674-4926/32/11/113001

11

Accurate surface potential determination in Schottky diodes by the use of a correlated current and capacitance voltage measurements. Application to n-InP

Ali Ahaitouf, Abdelaziz Ahaitouf, Jean Paul Salvestrini, Hussein Srour

Journal of Semiconductors, 2011, 32(10): 104002. doi: 10.1088/1674-4926/32/10/104002

12

Barrier height and ideality factor dependency on identically produced small Au/p-Si Schottky barrier diodes

M. A. Yeganeh, S. H. Rahmatollahpur

Journal of Semiconductors, 2010, 31(7): 074001. doi: 10.1088/1674-4926/31/7/074001

13

Structure optimization of a uni-traveling-carrier photodiode with introduction of a hydro-dynamic model

Li Guoyu, Zhang Yejin, Li Xiaojian, Tian Lilin

Journal of Semiconductors, 2010, 31(10): 104005. doi: 10.1088/1674-4926/31/10/104005

14

Exponential dependence of potential barrier height on biased voltages of inorganic/organic static induction transistor

Zhang Yong, Yang Jianhong, Cai Xueyuan, Wang Zaixing

Journal of Semiconductors, 2010, 31(4): 044002. doi: 10.1088/1674-4926/31/4/044002

15

A monolithic, standard CMOS, fully differential optical receiver with an integrated MSM photodetector

Yu Changliang, Mao Luhong, Xiao Xindong, Xie Sheng, Zhang Shilin, et al.

Journal of Semiconductors, 2009, 30(10): 105010. doi: 10.1088/1674-4926/30/10/105010

16

A linear stepping PGA used in CMOS image sensors

Xu Jiangtao, Li Binqiao, Zhao Shibin, Li Hongle, Yao Suying, et al.

Journal of Semiconductors, 2009, 30(2): 025003. doi: 10.1088/1674-4926/30/2/025003

17

Influence of Neutron Radiation on Performance of Color CMOS Image Sensors

Meng Xiangti, Kang Aiguo, Huang Qiang

Chinese Journal of Semiconductors , 2007, 28(S1): 583-587.

18

Design of a Monolithic CMOS LC-Voltage Controlled Oscillator with Low Phase Noise for 4GHz Frequency Synthesizers

Tang Lu, Wang Zhigong, Huang Ting, Li Zhiqun

Chinese Journal of Semiconductors , 2006, 27(3): 459-466.

19

A New CMOS Image Sensor with a High Fill Factor and the Dynamic Digital Double Sampling Technique

Liu Yu, Wang Guoyu

Chinese Journal of Semiconductors , 2006, 27(2): 313-317.

20

Peculiar Photoconduction in Semi-Insulating GaAs Photoconductive Switch Triggered by 1064nm Laser Pulse

Shi Wei, Dai Huiying, and Zhang Xianbin

Chinese Journal of Semiconductors , 2005, 26(3): 460-464.

1. Hu, C., Zhang, B., Xin, Y. et al. Analytical Modeling of Charge Behavior in Pinned Photodiode for CMOS Image Sensors. IEEE Sensors Journal, 2023, 23(13): 14295-14303. doi:10.1109/JSEN.2023.3278307
2. Liu, L., Yang, S., Yan, M. et al. Influence of Pixel Design on Charge Transfer in Pinned Photodiode CMOS Image Sensors. Journal of Physics: Conference Series, 2023, 2440(1): 012003. doi:10.1088/1742-6596/2440/1/012003
3. Liu, L., Guo, Y., Li, B. et al. Analytical Modeling of Potential Barrier for Charge Transfer in Pinned Photodiode CMOS Image Sensors. IEEE Transactions on Electron Devices, 2022, 69(10): 5637-5643. doi:10.1109/TED.2022.3200636
4. Yang, X., Huo, Y., Wang, Z. et al. Theoretical Simulation of Charge Transfer Loss Degradation of CMOS Image Sensor Induced by Displacement Damage | [位移损伤诱发CMOS图像传感器电荷转移损失退化的理论模拟研究]. Guangxue Xuebao/Acta Optica Sinica, 2022, 42(7): 0723002. doi:10.3788/AOS202242.0723002
5. Khan, U., Sarkar, M. Analysis of Charge Transfer Potential Barrier in Pinned Photodiode of CMOS Image Sensors. IEEE Transactions on Electron Devices, 2021, 68(6): 2770-2777. doi:10.1109/TED.2021.3071331
6. Capoccia, R., Boukhayma, A., Jazaeri, F. et al. Compact Modeling of Charge Transfer in Pinned Photodiodes for CMOS Image Sensors. IEEE Transactions on Electron Devices, 2019, 66(1): 160-168. doi:10.1109/TED.2018.2875946
7. De Ipanema Moreira, A., Michelot, J. A New Analytical Charge Transfer Model for Time-of-Flight Image Sensors. IEEE Transactions on Electron Devices, 2018, 65(12): 5400-5405. doi:10.1109/TED.2018.2873632
8. Rizzolo, S., Goiffon, V., Estribeau, M. et al. Influence of Pixel Design on Charge Transfer Performances in CMOS Image Sensors. IEEE Transactions on Electron Devices, 2018, 65(3): 1048-1055. doi:10.1109/TED.2018.2790443
9. Rizzolo, S., Goiffon, V., Estribeau, M. et al. Total-Ionizing Dose Effects on Charge Transfer Efficiency and Image Lag in Pinned Photodiode CMOS Image Sensors. IEEE Transactions on Nuclear Science, 2018, 65(1): 84-91. doi:10.1109/TNS.2017.2778760
10. Marcelot, O., Goiffon, V., Nallet, F. et al. Pinned photodiode CMOS image sensor TCAD simulation: In-depth analysis of in-pixel pinning voltage measurement for a diagnostic tool. IEEE Transactions on Electron Devices, 2017, 64(2): 455-462. doi:10.1109/TED.2016.2634601
  • Search

    Advanced Search >>

    GET CITATION

    Chen Cao, Bing Zhang, Junfeng Wang, Longsheng Wu. Measurement of charge transfer potential barrier in pinned photodiode CMOSimage sensors[J]. Journal of Semiconductors, 2016, 37(5): 054007. doi: 10.1088/1674-4926/37/5/054007
    C Cao, B Zhang, J F Wang, L S Wu. Measurement of charge transfer potential barrier in pinned photodiode CMOSimage sensors[J]. J. Semicond., 2016, 37(5): 054007. doi: 10.1088/1674-4926/37/5/054007.
    shu

    Export: BibTex EndNote

    Article Metrics

    Article views: 3633 Times PDF downloads: 78 Times Cited by: 10 Times

    History

    Received: 11 September 2015 Revised: Online: Published: 01 May 2016

    Catalog

      Email This Article

      User name:
      Email:*请输入正确邮箱
      Code:*验证码错误
      Chen Cao, Bing Zhang, Junfeng Wang, Longsheng Wu. Measurement of charge transfer potential barrier in pinned photodiode CMOSimage sensors[J]. Journal of Semiconductors, 2016, 37(5): 054007. doi: 10.1088/1674-4926/37/5/054007 ****C Cao, B Zhang, J F Wang, L S Wu. Measurement of charge transfer potential barrier in pinned photodiode CMOSimage sensors[J]. J. Semicond., 2016, 37(5): 054007. doi: 10.1088/1674-4926/37/5/054007.
      Citation:
      Chen Cao, Bing Zhang, Junfeng Wang, Longsheng Wu. Measurement of charge transfer potential barrier in pinned photodiode CMOSimage sensors[J]. Journal of Semiconductors, 2016, 37(5): 054007. doi: 10.1088/1674-4926/37/5/054007 ****
      C Cao, B Zhang, J F Wang, L S Wu. Measurement of charge transfer potential barrier in pinned photodiode CMOSimage sensors[J]. J. Semicond., 2016, 37(5): 054007. doi: 10.1088/1674-4926/37/5/054007.

      Measurement of charge transfer potential barrier in pinned photodiode CMOSimage sensors

      DOI: 10.1088/1674-4926/37/5/054007
      Funds:

      Project supported by the National Defense Pre-Research Foundation of China (No. 51311050301095).

      • Received Date: 2015-09-11
      • Accepted Date: 2015-10-24
      • Published Date: 2016-01-25

      Catalog

        /

        DownLoad:  Full-Size Img  PowerPoint
        Return
        Return