1. Introduction
In recent years, photocatalytic oxidation technology has been found capable of effectively removing pollutants[1]. Photocatalytic technology is the core of photocatalysts. Anatase TiO2 is in the focus of photocatalytic research because of its strong oxidizing property, high catalytic ability, etc. The anatase TiO2 surface has an important impact on photocatalytic activity, photovoltaic properties, and gas sensor characteristics. Hence, an intensive study of the anatase TiO2 surface is very significant. The most stable surface of anatase TiO2 is the (101) surface, followed by the (100) and (001) surfaces. Hebenstreit et al.[2] and Hengerer et al.[3] have conducted a study on the (101) surface of anatase TiO2 by low-energy electron diffraction and scanning tunneling microscopy (STM), and have obtained the STM images of the anatase surface in a vacuum environment. Some four coordination Ti atoms are found to exist on the surface, containing O vacancies. Ma et al.[4, 5] have studied the anatase TiO2 (101) surface and superficial native defects. They have concluded that Ti and O point defects easily form on the outer surface. Emanuele et al.[6] and Chen et al.[7, 8] have studied the N doping anatase TiO2 (101) surface. N-doping the surfaces with O vacancies is found to be easy. With increased doping concentration, the forbidden bandwidth decreases. However, there is not much research on the optical character of the anatase TiO2 (101) surface. The current paper provides basic theoretical data for experimental studies on the electronic and optical properties of the anatase TiO2 (101) surface by first-principle calculations as well as analyses of the geometric structure, surface energy, electronic structure, bond length, electronic populations, and optical character.
2. Computational details
The anatase TiO2 space group is I41/amd, which has a square crystal structure. Every primitive unit cell contains four Ti atoms and eight O atoms. All calculations based on the density functional theory (DFT) and plane wave ultrasoft pseudopotential method were performed using the VASP package[9].
The model was built as follows. First, to establish the body model with the different calculation methods for optimization, the optimization of energy convergence criteria was set to 1 × 10

|
 DownLoad:
CSV
| Show Table
DownLoad:
CSV
| Show Table
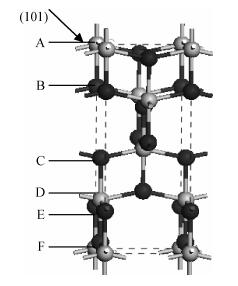
The PBESOL scheme was chosen as the optimal calculation method in the current paper. Diebold[17] has proposed that the share of the anatase TiO2 (101) surface is more than 90%; thus, the (101) surface was established based on the optimized body configuration. Considering that bond breaking situation and atomic positions of the surfaces is different, six different surface atomic termination structures existed on the vertical (101) surface, as shown in Fig. 1. For the six structures, the crystal surface cells were established, the atomic number of unity was 12 and the chemical formula was Ti4O


|
DownLoad:
CSV
| Show Table
3. Results and discussion
3.1 Geometric structure of the anatase TiO2 (101) surface
Table 2 shows that after the optimization of the anatase TiO2 (101) surface, class C and F structures (Fig. 1) have the lowest energies. This finding means that anastase surface atoms terminated by the class C structure are most likely to appear on the surface. The outer layer of the surface is composed of two coordination O atoms, and the second layer is composed of five coordination Ti atoms. This result is consistent with that of Ma et al.[4]. The discrepancy possibly originates from the different selection models and computational methods. The result is consistent with that of Hebenstreit et al.[2], who has used STM to observe the anatase TiO2 (101) surface. Two coordination O ions, five coordination Ti ions, and a small amount of four coordination Ti ions on the anatase TiO2 (101) surface are found. The small amount of four coordination Ti ions observed in experiments may be due to O vacancy defects.
3.2 Surface energy
The selected number of atomic layers and layers on the vacuum surface greatly influence the surface energy. Ma et al.[4] have concluded that the surface begins to converge when surface atomic layers are more than three layers, and the vacuum layer is thicker than 4 Å. To facilitate an accurate calculation of the surface energy, the computer ability and computational accuracy must both be considered. This paper establishes an 18-layer surface atoms model with upper and lower vacuum thicknesses of 8 Å to remove upper and lower surface interactions. The surface energy definition is:
|
Esur=12A(Eslab−NslabNbulkEbulk), |
(1) |
By the calculated surface crystal cell, the surface area for A is 5.56 × 7.60 Å
3.3 Relaxation of anatase TiO2 (101) surface atoms
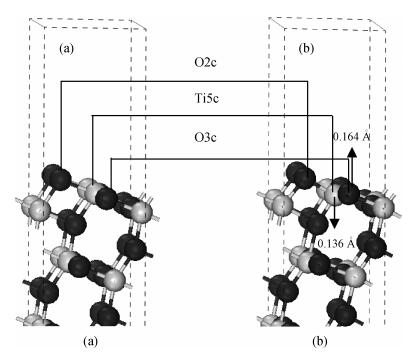
The anatase TiO2 (101) surface structure is optimized by relaxing surface atoms to eliminated surface atomic tension. The surface atomic position is adjusted to reduce the total energy of the system. Figure 2 shows the structure before and after optimization. After optimization, the atomic surface underwent relaxation, but not reconstruction. The top layer of the surface is still a two-coordinated O (marked as O2c), the sub-layer is a three-coordinated O (marked as O3c), and the third layer is a five-coordinated Ti (marked as Ti5c). After relaxation, the nearest neighbor titanium atoms moved 0.136 Å toward the inner layers and the nearest neighbor oxygen atoms moved 0.164 Å toward the surface, as shown in the arrow symbols.

3.4 Surface electronic structure
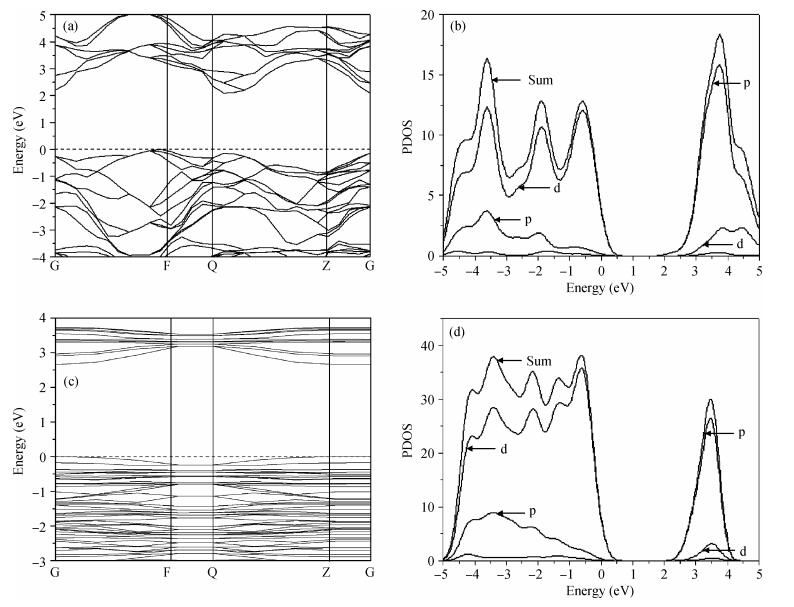
Figure 3 shows the band structure and density of states of anatase TiO2 (101) surface and bulk. Comparing the energy band diagrams in Figs. 3(a) and 3(c) reveal that the bulk energy gap

3.5 Bond lengths and charge population
The bond lengths and charge population of ideal and relaxation surfaces are shown in Table 3.

|
DownLoad:
CSV
| Show Table
Table 3 shows that the bond lengths significantly change after surface relaxation. The most obvious change is in the Ti5c-O2c bond length, which reduces 0.171 Å. The Ti6c-O2c bond length reduces 0.099 Å, which can mainly be attributed to the O2c ion losing the linked Ti ion above it. The outermost layer of the surface is O2c, which indicates that this surface very easily forms O vacancy defects.
Table 4 shows that the TiO2 (101) surface atomic charge distribution has also changed. Extranuclear electron transfer in O2c and Ti5c is relatively larger. The charge population near O2c increase 0.05e, the charge population near Ti5c increase 0.03e, and the charge in the vicinity of Ti6c reduce 0.03e. The charge transfer of other nearby atoms is relatively small. The general trend of charge transfer is from surface to inner atoms.

|
DownLoad:
CSV
| Show Table
3.6 Optical properties
After the computational optimization of the TiO2 (101) surface, the real and virtual parts of the dielectric function versus. photon energy change curve are shown in Fig. 4. There are three peak positions in the imaginary part. The first high and sharp peak appears at 2.9 eV because the valence band O2p states jump to the conduction band Ti3d states, according to analyses of the energy band diagram and density of states. The second and third peaks are at 19.5 eV and 35.8 eV mainly owing to the electron transition from the O2s state to the Ti3d state.
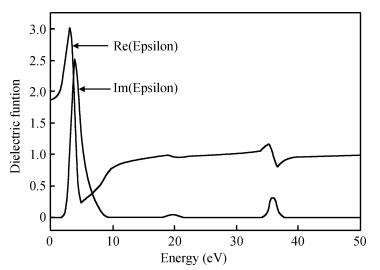
Figure 5 shows no absorption in the low-energy region. An absorption edge, which gradually appears near 2 eV, is observed near the ultraviolet region. This finding illustrates that the TiO2 (101) surface very weakly absorbs long-wavelength energy, such as visible light.
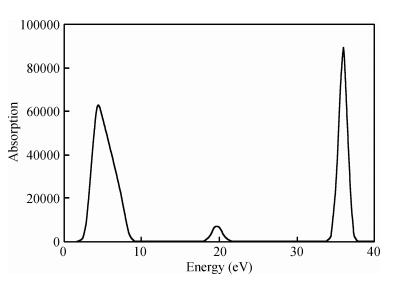
Considering that the correction factor is 1.06 eV, the corresponding energy is 3.06 eV after correction of the absorption peaks. The corresponding absorption wavelength is calculated as:
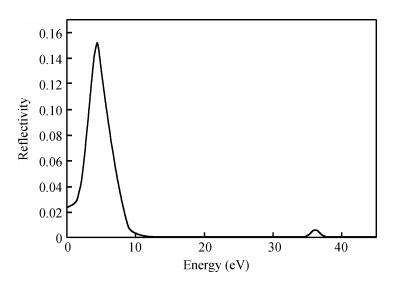
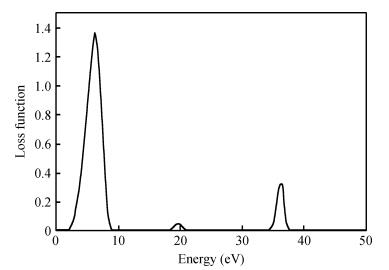
The TiO2 (101) surface reflection spectrum is shown in Fig. 6. There are two reflection peaks at 4.5 and 36.1 eV. Figure 7 is the energy loss spectra. The energy loss spectrum describes the energy loss of electrons when passing through a uniform dielectric, and the energy loss peak describes the plasma resonance frequencies. The main energy loss is at about 7.6 eV. Figures 6 and 7 reveal that the energy loss peaks correspond to the sharp decline in the reflection spectrum.

4. Conclusion
In the current paper, analyses of the geometric structure, surface energy, electronic structure, bond length, charge population, and optical properties of the anatase TiO2 (101) surface were performed by the first-principle method based on the DFT with the plane-wave ultrasoft pseudopotential method. The calculation results show that:
(1) The most likely structure of the anatase phase TiO2 (101) surface is terminated by two-coordination O atoms, and the sub-layer is terminated by five-coordinated Ti atoms. This superficial termination is the most stable and has the lowest energy.
(2) The energy of an 18-layer surface model is 0.580 J/m
(3) The surface electronic structure is similar to that of the bulk, and the surface state does not appear. The width of the surface band gap increases 0.36 eV compared with the bulk phase.
(4) Changes in surface bond lengths are obvious after relaxation, with the Ti5c-O2c bond length reducing about 0.171 Å. Surface electrons transfer to the body. Surface atomic relaxation occurs without reconstruction. After relaxation, the top layer of surface atoms is still two-coordination O, the sub-layer is a three-coordination O, and the third layer is a five-coordination Ti.
(5) A series of optical parameters such as real and virtual parts of the dielectric function, absorption coefficients, reflex spectra, and energy loss spectra have been analyzed in the paper. There is no energy absorption in the low-energy region. An absorption edge appears near the ultraviolet region. The corresponding energy is 3.06 eV and the corresponding absorption wavelength is below 405 nm by calculation.
 DownLoad: